Long weekend in US due to Thanksgiving day. Black Friday with queues to stores, discounts and sales. Retail companies’ stocks surge on Wall Street. Who trades currencies these days? Fx market has been thin with very low volume of trading. But this is very good time for miracles. These conditions allow big sharks like hedge-funds and other pirates to move the market, cause this task becomes much easier. We’ve observed a sharp movement in some assets during Friday NY session, right before closing the trading week. And the biggest question about that movement is: What was that? Profit taking? Was it a try to shake out the market and move it out of the tight range we’ve been seeing recently? Or maybe it was a try to touch water in the scope of the volume of orders placed above certain technical levels? Let’s try to figure out.
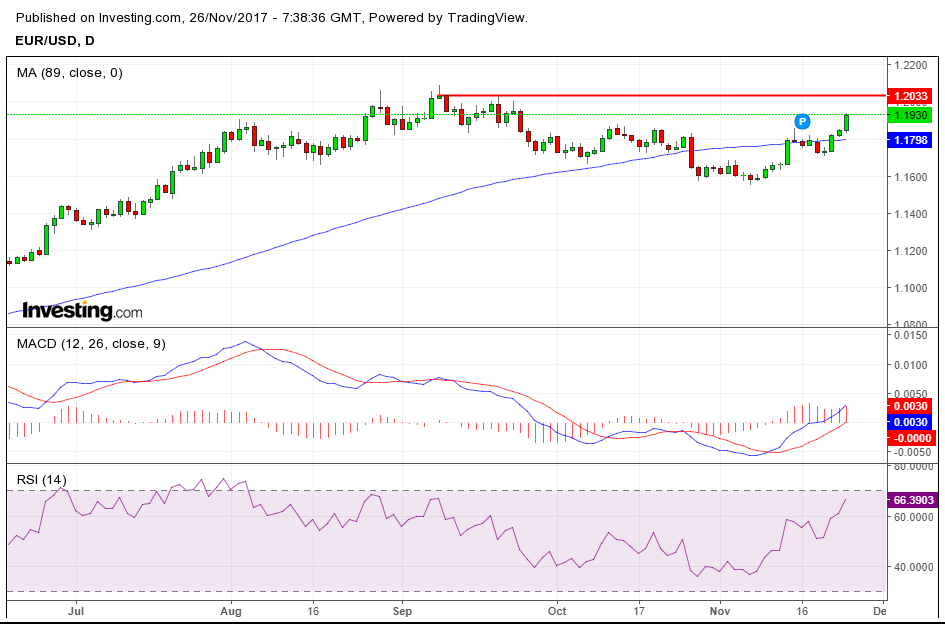
First of all I mean EURUSD. The most traded currency pair surged 0.68% on Friday without any significant economical report, closing the week above 1.19 level, first time in two months. Someone will say that Fed officials drove the pair by expressing fresh concerns regarding low inflation in US. But is it really new thing to the market players? Don’t think so. Someone will say that it’s about the US treasuries yields adding 0.7/1.0% on Friday and,thus, lowering the demand for credit capital flow. Investors in this segment have more risk appetite recently and they turn their attention to more attractive assets out of US. Such a bullish sentiment comes from stocks, which are already expensive. But despite that fact, leading worldwide indices continue attracting buyers. One more confirmation comes from safe havens. Look at the prices of GOLD, they pulled back from highs around $1293, failing to test important psychological level of $1300 per ounce.
Technically, the daily EURUSD chart below is bullish. MACD lines have wide spread and both moved to positive territory, pointing for further highs. RSI is above 50% level in a sustainable way, but rather far from overbought extreme levels yet, leaving the room for more appreciation. The prices have three daily closings above SMA89 in a row, confirming bullish market sentiment. Next pivot point is 1.2033 and we need to see a sustainable daily close prices above local highs posted on September 8th in order to see the continuation of the uptrend. No shadows, no tails, no whipsaws. CLOSE daily price. I would recommend to look for pullbacks intraday to those who missed this northwards movement and who wants to join the party and jump into the outgoing train. My long-term target of $1.25 for one EURO remains in play and I hope to see it before the end of the calendar year.
Very interesting picture I see on USDJPY daily chart. There is a bullish Doji Star formed last Thursday. It is a very strong reversal bullish signals, especially when it comes to japanese assets. I mean Japanese Candlestick Patterns must work with Japanese assets in the best way, otherwise they would not be invented there. Yes, the prices are still inside the span and the lines of Ichimoku are not in a right order for bullish continuation, but we can see first signs of reversal thanks to the latest upside Friday price action. Look at the green line, it has reversed and crossed the brown line, which could be a sign. Preliminary, but sign. First target to confirm my suggestions is to get out of the could (slightly above 112.00 currently) and accomplish the reversal pattern by a cross of blue and brown lines. In this case we could see a comeback of USDJPY to normal recent range 113.50/114.00. But please do not ask me when is it going to happen…

As you can easily guess, one of the most attractive pairs to trade with remains EURJPY. And the main reason is because fundamentally it does not depend on what is going on with the US tax reform, congress vote, political concerns and President’s tweets. Diversification, if you will. European economy continues to show strong performance and remains one of the most attractive marketplaces for Japanese investors, exporting the capital. Technical analysis of EURJPY confirms the fundamental attractiveness of the pair. First of all, the prices got out of the cloud after two failed attempts to break the bottom of the span (November 20 - lowest local prices). Secondly, the Friday bullish candle managed to close above both lines of the Ichimoku. Thirdly, daily close prices (113.08) are above local high from November 02 (113.00). The strategy is the same - buy dips. Targets: 113.85 and 134.37 for the nearest future, and 136.00 Yen per one Euro for the upcoming weeks.
The upcoming week is full of important economic events, in contradiction with the previous one. Among the headliners are British GDP and manufacturing PMI, US Consumer confidence and GDP, Chinese Manufacturing PMI, German unemployment and Manufacturing PMI, Eurozone GDP together with GDP and unemployment for Canada. Getting ready to volatile trading week especially in the scope of upcoming Fed meeting and rate decision. The odds for another rate hike are very high, so any possible disappointment could drive the greenback much lower.
____________________________________________________________
If you are interested to get more fx market analysis, please contact author:
email: lucas.tyler.ssfx@gmail.com
WhatsApp: +380931328731


No comments:
Post a Comment