You can find a lot of sources for fundamental news about crypto and Bitcoin. This topic became very popular, so top news agencies picked it up quickly. I will just mention one important rumor, circulating on the market this week. They say that Bitcoin futures will be trading on NASDAQ and Chicago Mercantile Exchange in the first half of 2018. What does it mean? It means that once the asset becomes regulated, institutional investors will have permission to trade it. And this will bring huge volume to the market. Bitcoin capitalization reached $162 billion, more than giants like IBM, McDonalds and General Electric. It was key driver for bulls to push the prices higher on Friday session.
But I will talk about technical analysis here. Despite the fact that Bitcoin is a new asset class, something that never been in use before, the trading rules remain the same. There will be overbought and oversold ranges, resistances and supports, pullbacks and retracements. Technical analysis is secondary, the most influence comes from fundamentals. But still it’s very important tool to use in every trading strategy. You should understand one more important thing. There are lots of different sources of the exact price of Bitcoin and quote of BTCUSD asset. It depends on what exchange you use for conversion of cash to crypto and vice versa. Localbitcoins is one of the most popular echanges supporting instant buy and sell Bitcoins for cash in 258 countries.

I tried to use different technical indicators for BTCUSD. They work very bad mostly in such price action as we see in 2017. +992% wow. So we need to keep the technical analysis as simple as possible. I have shown one simple and effective trendline in my previous post. I also checked Fibonacci retracement levels and got some results. I use daily time frame for all of the charts below. You can see four stages of growth and retracements on the chart above.
Here are some figures about these ranges:
stage
|
price from
|
price to
|
change
|
change, %
|
1A
|
891.00
|
3000.00
|
+2109.00
|
+236.7%
|
1B
|
3000.00
|
1835.80
|
-1164.20
|
-38.8%
|
2A
|
1835.80
|
4827.40
|
+2991.60
|
+162.95%
|
2B
|
4827.40
|
2981.00
|
-1846.40
|
-38.3%
|
3A
|
2981.00
|
7895.00
|
+4914.00
|
+164.8%
|
3B
|
7895.00
|
5786.10
|
-2108.90
|
-28.7%
|
4A
|
5786.10
|
11187.00
|
+5400.90
|
+93.3%
|
You can find enlarged charts of the ranges below together with Fibonacci retracement levels. Please note that I use the Fibo indicator for CLOSE daily prices, not HIGHS or LOWS
1A-1B. Both retracements (blue arrows) closing prices are above 50% level.

2A-2B. Three Fibo levels worked well to renew longs or take profit of shorts. 38.2% (red arrow), 23.6% (blue arrow) and 61.8% (green arrow).
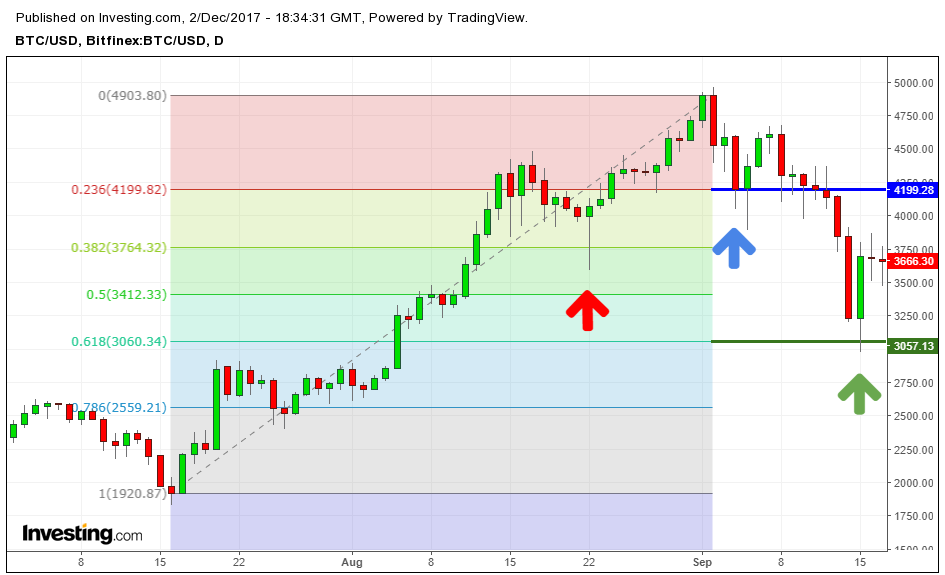
3A-3B. The retracement closing price fits exactly in 38.2% Fibo level (green arrow).

4A. This stage is not accomplished yet. As you may see from the spreadsheet below, we could expect further upside movement for 4A stage as it’s +90% roughly so far. But at the same time, Fibo levels worked well during both volatile sessions this week: Thursday and Friday. Low prices fit in 38.2% level and closing prices are above 23.6% mark. Red arrow on the chart below.
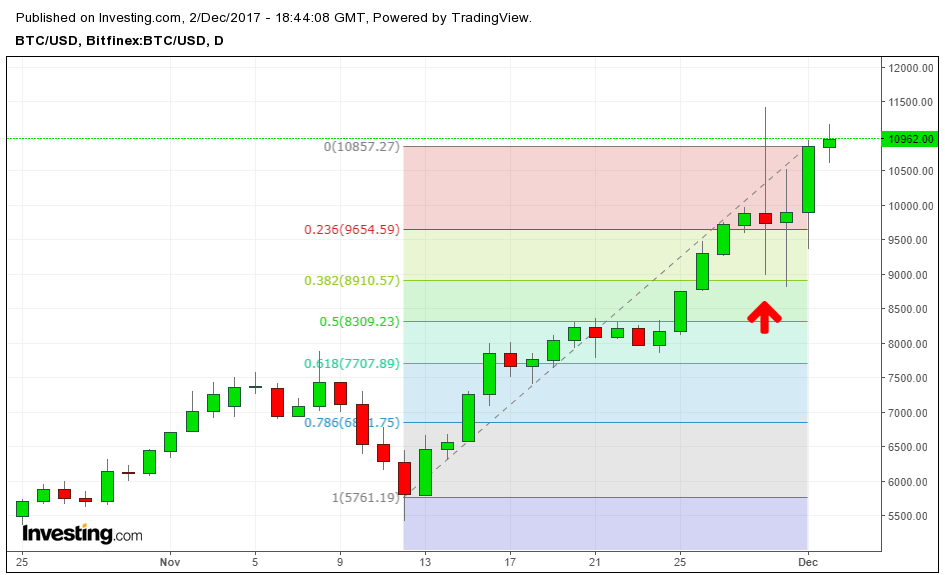
Technical conclusion. We can expect further upside run up to $15082.80 per one Bitcoin (+161.8% from NOV-13 open price). And we’ll be looking for retracement back to a level around $11523.25 (38.2% Fibo).
Let the profit be with us!
____________________________________________________________
If you are interested to get analysis of other cryptocurrencies, please contact author:
email: lucas.tyler.ssfx@gmail.com
WhatsApp: +380931328731


No comments:
Post a Comment