Please note, that this article comes from my archive. Check the actual date in the header.
Second week of busy season picked up the momentum in trading. The main headliner of the week was Bank of England, as expected. MPC minutes showed surprising hawkishness of the regulator. But was it that unexpected? It should of been happened a long time ago. Brexit impact was not that scary, the British economy was doing well recently. Inflation picked up with the August CPI report +2.9% YoY (vs + 2.8% expected). There is a delay in wage growth, but unemployment figures were low in July (4.3%). BoE left the interest rates and QE programme unchanged, but stated readiness to lower the amount of liquidity injection and even to start tightening cycle, if the economy continued to show strong performance.
Some economists say that the regulator decided to ‘touch the water’, asking a permission from the markets to start tightening. One of the confirmations of such suggestion is the press-conference of MPC Governor mr.Carney. They decided not to have it right after the meeting, but to postpone it till Monday morning, having two business days to see the market’s reaction for the statement. Meantime, the pound soared versus everything, breaking important technical resistances and levels. It will be very interesting to listen to mr.Carney on Monday and to see his reaction on market’s reaction. British central bank is not like Bank of Canada, they talk a lot before doing something. Anyway, market’s odds for a rate hike jumped up to 45% in November and 80% in February. Sterling is already pricing in new tightening cycle.
The weekly changes of several pound pairs will tell you more:
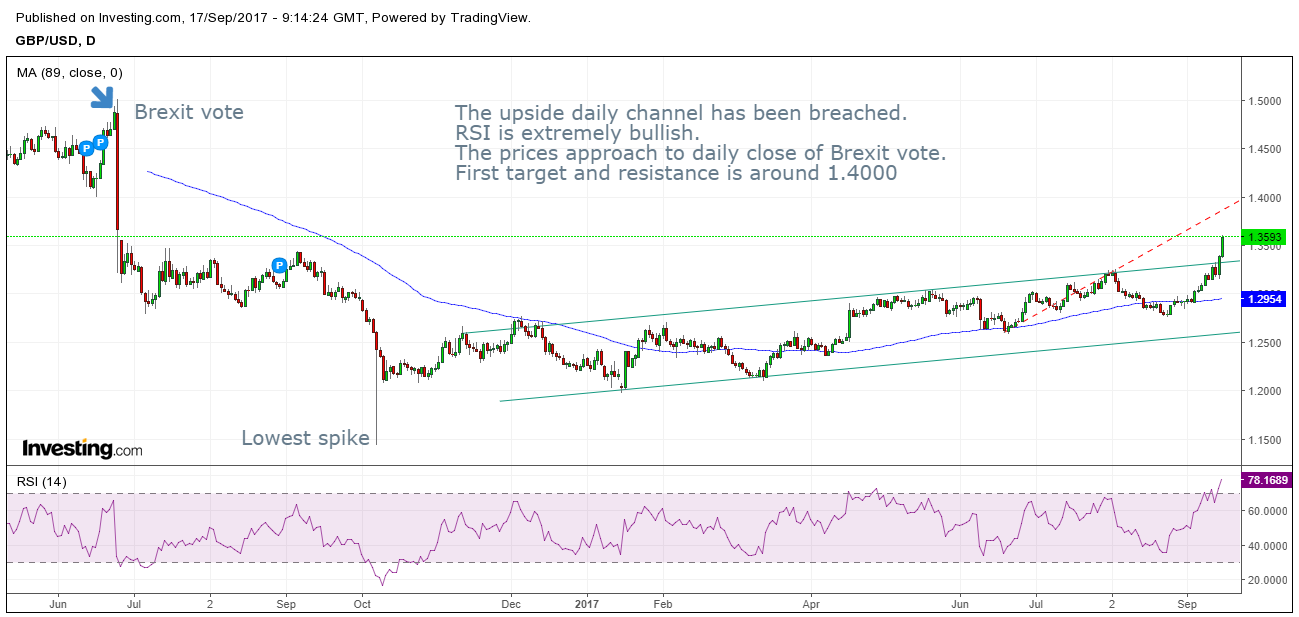
GBPUSD 1.3593 +389 pips (+ 2.95%)
GBPCAD 1.6576 +524 pips (+ 3.26%)
GBPAUD 1.6987 +623 pips (+ 3.81%)
GBPCHF 1.3048 +576 pips (+ 4.41%)
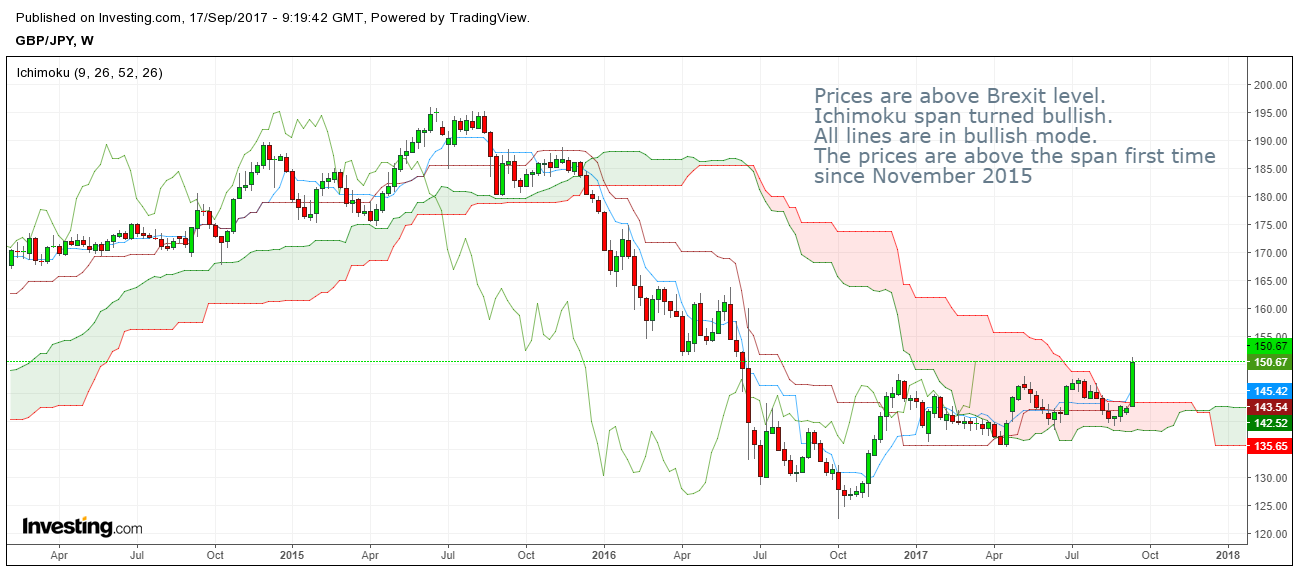
GBPJPY 150.67 +783 pips (+ 5.48%)
EURGBP 0.8786 -334 pips (- 3.66%)
Continuation of this new trend in sterling pairs will depend on three factors: the British economy has to keep posting strong reports, BoE has to act as they told and FOMC has to keep talking in a dovish sentiment. Such a combination of fundamentals can push the pound up to 1.5000 versus the greenback and up to 165.00 versus the yen. While the first pair is just recovering after the Brexit sell-off, the second one is already above the June 2016 levels, before the vote, where it started to fall from.
The best trading strategy in this environment will be ‘buy-dips’. The prices cannot go up in one direction, the market will give a depth to jump in for those, who missed initial spikes. The first volatile action is planned during the MPC press-conference on Monday, 8:00 AM London time.
You may find several technical charts below.
GBPUSD daily:
GBPJPY weekly:
GBPJPY H4:

The greenback bulls tried to raise the heads past week. Higher-than-expected US CPI August report on Thursday (+1.9% YoY vs +1.8% consensus) gave them support initially. But the USD did not manage to hold the gains. The bears stepped in and USD ended the week in a traditional weakness pace with the disappointing US Retail Sales August report (-0.2 % MoM vs +0.5% expected), revising the previous month lower as well (+0.4% from 0.5%). Yes, the inflation picked up a bit, but it is still below the FOMC target range (2.0/2.5%). These reports gives the Fed nothing but to continue to spread out the hands saying: No inflation - no rate hike. Key event for the markets to watch in the upcoming week will be the FOMC meeting on Wednesday 5:00 PM NY time.
We do not expect anything new from the FOMC. We do not expect any reversal in USD downtrend. EURUSD gave depth to renew longs, bouncing to lowest rate since end of August around 1.1838. Weekly candle is bearish with a shadow on downside. But the daily technicals are still bullish with the RSI14 still above 50% level. The big question for EURUSD is about the technical daily divergences. The upcoming week with the Fed on tap and several EUR economic reports like CPI and German ZEW, plus the Draghi’s speech scheduled for Thursday, will determine how fast EURUSD will get into the target range of 1.2000/2500.
Technically, the same buy-dips strategy remains in play. The H4 chart below shows us a consolidation around SMA89 with RSI14 back above 50% level and MACD settling for next bullish pattern. The only question for us is the time when MACD blue line will cross 0 level and the EURUSD will continue posting new highs. The target and resistance remain the same as well: 1.2060 to close the day above and move on.
EURUSD H4 chart:

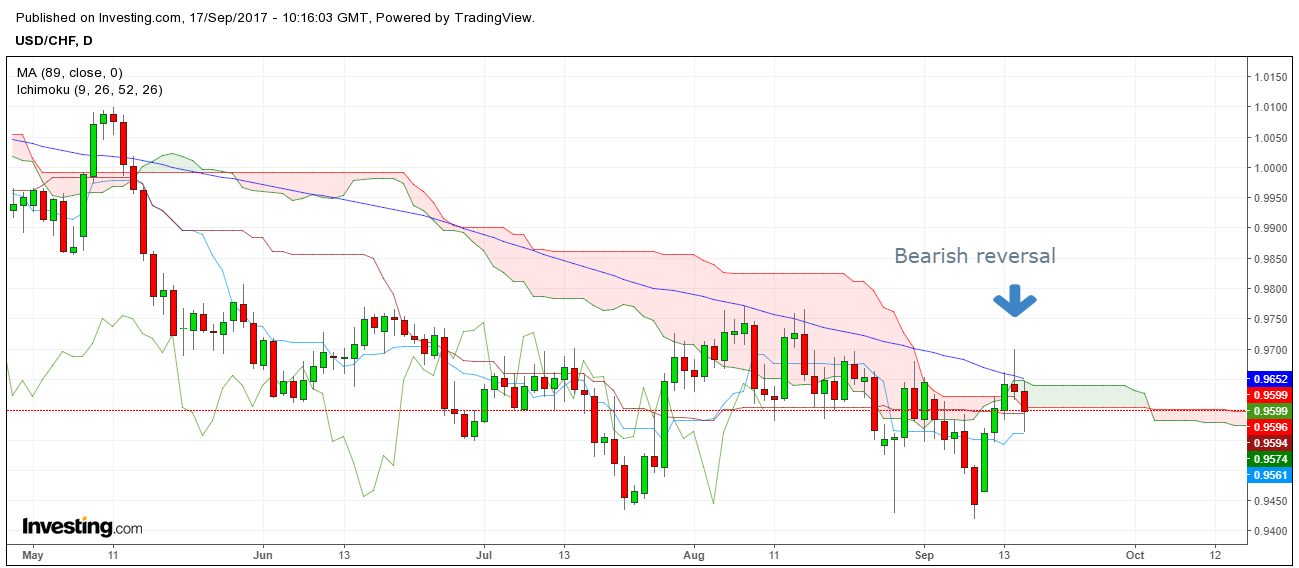
There is one more confirmation of the thoughts written above. There is an interesting technical picture in USDCHF, which always has been a leading indicator for the greenback. The daily chart below shows two failed attempts of the prices to break through Ichimoku cloud. Usually, it’s a sign of weakness and strong bearish reversal signal. By the way, SMA89 also remains strong resistance level of the daily downtrend.
Take a look:
Bank of Japan has the meeting and press-conference scheduled for Thursday, right after the FOMC colleagues, or competitors, if you will. USDJPY has been rising all past week, ending at strong levels just a bit lower 111 figure: 110.86 was the exact close weekly price, highest since the last week of July. Everything is in favour of Japanese exporters and yen bears: the world economy is strong, geopolitical tensions eased, equities rise, major central banks are close to start normalization of the monetary policy. USDJPY together with crosses could be supported by both real-money and speculative flows.
Technically, it has to go back above 112.50 in order to continue the uptrend. But there are several resistances before that historically important level. Daily prices are still below the Ichimoku span with the range of 110.96/111.66, which is still bearish, but narrowing the depth. Lines show a mixed picture with first signs of possible bullish reversal. Confirmations as strong upside are needed to complete the reversal pattern.
Daily USDJPY chart:

We would not stand against yen bears despite the weakness of the greenback. EURJPY was also strong last week (closing at 132.38) despite the EURUSD slide. We talked about this cross-rate couple weeks ago, explaining fundamental reasons why we think it will continue the uptrend with the target of 140 yen per one euro.
Gold futures prices slided from highs, closing the week at $1325.20 per troy ounce. We have a doubt that the uptrend has strong continuation background. And the main reason is fundamental. It would be a nonsense to see the gold rising together with majority of central banks tightening. If the upside moves failed to post new highs above 1362.40, we could see a further downside to 1310/00 support range. Intraday technicals are mixed, showing possible reversal. RSI14 is below 50% level and the prices are clearly below SMA89 first time since mid July 2017. We’ll be looking for highs to short Gold in the week ahead.
GOLD Futures H4 chart:

Let the Profit be with us!
Please note, that this article comes from my archive. Check the actual date in the header.
____________________________________________________________
If you are interested to get more fx market analysis, please contact author:
email: lucas.tyler.ssfx@gmail.com
WhatsApp: +380931328731


No comments:
Post a Comment