Please note, that this article comes from my archive. Check the actual date in the header.
5 technical reasons why we are still bullish on USDJPY
H4 chart :
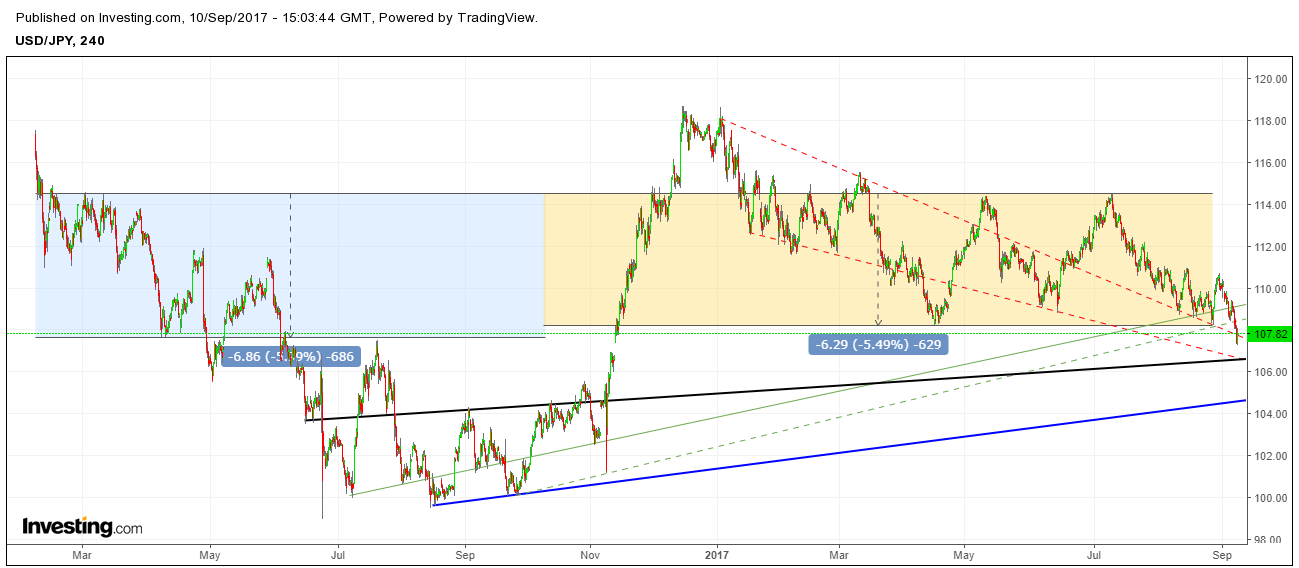
- The price is above lower blue horizontal channel from spring 2016
- The price is above blue support line despite that it’s below two green support lines
- The price is still above upper red dotted median line
- The price is still above lower red dotted line. Both red lines indicate a descending support retracement channel
- The price is still above black support line.
We will consider longs from 106.85 level. Traders shorting the USDJPY should think of profit taking around this level.
Please note, that this article comes from my archive. Check the actual date in the header.
____________________________________________________________
If you are interested to get more fx market analysis, please contact author:
email: lucas.tyler.ssfx@gmail.com
WhatsApp: +380931328731


No comments:
Post a Comment