Thursday, November 30, 2017

Will the Bitcoin crush?

Breathtaking Bitcoin price action on Wednesday, surging 10% in the first half of the day and declining -5% in the second. Rumors about NASDAQ to add Bitcoin futures to trade officially accelerated rush to buy cryptogold. Unprecedented demand triggered take-profit action. Asian buyers stepped in around $9000, pulling the prices higher on Thursday. But that was also fake upside run. Bad news came from US court, forcing one of the biggest Bitcoin exchanges to provide full information of its’ customers invested more than $20000 together with all their transactions. Anonymous, you say?..


I do not care about the destiny of this specific asset. Some people say it’s just the start of bright future and we will see Bitcoin prices above $100000 very soon. Some people say it’s the biggest bubble in history and we’ll see rivers of blood very soon. As you can see from my view posted on last Sunday, I DO NOT CARE. I open a speculative position when I see good odds and return ratio.


I’m preparing a deep technical outlook for BTCUSD asset. So far I can give you one example. Open daily chart and try to draw a simple trendline. Just connect HIGH price from AUG-15 and HIGH price of NOV-08. Extend the line to the right side. You understand, that this line could be drawn before NOV-30, right? So tell me please, is it a fortuity that LOW price of NOV-30 sell-off is exactly at the same line? - No, it’s not. This rule is old and is suited for any asset technical analysis: once a resistance is breached, it becomes support. So I took my profits of my fresh shorts around $9K and I’m sitting squared. I suspect a further slide south, so stay tuned for updates and further analysis.


Let the profit be with us!


____________________________________________________________
If you are interested to get analysis of other cryptocurrencies, please contact author:
WhatsApp: +380931328731

Three reasons why I'm short on SILVER

The first one is risk-on sentiment across the board. Key fundamentals are described in the previous post. The main idea is that traders are getting out of the safe havens shifting the focus to high-yield assets. So the prices of precision metals like gold and silver slide due to decrease in demand together with stable supply.

Second reason is that silver traditionally follows gold’s price action. The H4 chart below shows me strong resistance below $1300.00 per ounce, 1295.99 to be precise. A failed attempt to break above it caused the pullback we see during last 48 hours. The prices are far below Simple Moving Average with 89 period (one of the Fibonacci numbers) and recent blue support line. This pattern increases further downside risks.

Third reason is the technical picture of the silver itself. I like to keep the analysis simply stupid and avoid too much complicated indicators. I guess you’ve noticed such charts, when you can’t see the price behind of indicators. I use Bollinger Bands indicator, it works well for my silver trades. First chart below is daily. You may see the bearish sell signal (NOV-17, red arrow), when the prices tried to reach the upper BB range. There are also two bearish japanese candlestick continuation patterns: Engulfing (NOV-29) and Three Outside Down (NOV-30). Add here BB continuation signal (two daily close prices below the range, blue arrow), and it would be more than enough to be confident about holding the silver shorts and hope for further downtrend.

The margin requirement for silver is much higher than for gold or EURUSD, and the spreads are wider, but it pays off with the volatility. Current profit is 600+ pips and still running. Those traders who missed the opportunity can still join the party on intraday upside corrections. Please feel free to contact me to get more information about simple and effective Double-Bolly intraday trading strategy.


Let the profit be with us!

____________________________________________________________
If you are interested to get more fx market analysis, please contact author:
email: lucas.tyler.ssfx@gmail.com
WhatsApp: +380931328731

Top 4 currency pairs to trade on Friday.

The volatility is back to the markets on the last day of November. Trading season is approaching to the last month of the year 2017, leaving just three weeks before the Christmas pause. One of the main drivers was is risk appetite. Safe havens like gold and bonds lose their shine, while high yield assets like stocks become more attractive despite historically high prices. Positive rumors from US Senate to pass the Friday vote for the Republican tax bill together with stronger-than-expected GDP release pushed US stock indices to fresh highs. DJIA leads the bullish run and the main reason is that big corporations would benefit more from the tax reform. Do you really think it was designed to help poor people or to protect the middle class?..


Thursday trading session was positive for the EURO, driven by the factors above together with economic reports beating expectations: German unemployment change (-18K vs -10K), Eurozone unemployment rate (8.8% vs 8.9%) and EU Consumer Price Index (+1.5% vs +1.4%). the last one is monitored by ECB very closely and if it will be able to pick up the momentum, we could see the regulator acting to tighten the monetary policy much more earlier than they predicted at the last meeting. EURUSD is back above 1.19, with further upside potential. Technically, hourly chart below has a flag continuation pattern, while fast RSI oscillator is far from overbought levels, leaving the space for northwards run. My buy-dips strategy for the week, posted below, works well so far.


USDJPY as the risk-appetite indicator, has the same fundamental supportive factors described above. Technically, there are two strong signals on H4 Ichimoku indicator below. First, the span is crossed and turned bullish. Second, the price managed to get out above the cloud. All the lines are in bullish mode as well, so I expect the pair to reach the range of two previous local highs between 113.19 and 113.85 today. A sustainable close of the week in this range could cause further upside surge next week. I guess, there is no need to remind you about attractiveness of EURJPY longs as the result of both EURUSD and USDJPY being bullish.


Sterling was among the leaders on Thursday. Fundamentally, there are rumors about EU and UK politicians seeing the light at the end of the Brexit tunnel. Some people would say that the GBPUSD run of 400 pips in last three weeks is a huge achievement. I’m not impressed, to be honest, cause I remember times when cable used to move 200 pips per day. Anyway, British Manufacturing PMI is in focus on Friday’s calendar and positive reading could give a lift for the pound to continue the run. From the technical point of view, I would stay away from buying GBPUSD on local top of the market. First reason is that daily RSI is in overbought territory. Secondly, the cable could have a double top (lower highs) formation in case if the price will not be able to close above previous high at 1.3593. Some would say that Bollinger Bands indicator points to higher prices by closing above the range. I would answer them that it loves false breaks and signals, look at the previous one on September the 15th.


I would consider aggressive longs of GBPJPY though. But not on top of the market of course. This pair is volatile, so there will be a pullback before continuation of the uptrend. Ichimoku cloud indicator shows me an attractive range of 151.21/61 to jump in. Small accounts should be cautious about trading this pair due to high volatility and cut potential losses 20-30 pips below 151.00. Those who can allow themselves to stay underwater for some time, should watch the range 149.71/150.20 to add longs. Targets? I do not see any significant resistance before 155.60, so it’s more than 400 pips to go north.


USDCAD is in focus for Friday trading. Canadian GDP and Employment reports are scheduled to release at 8:30 NY time. Expectations are rather modest: 0.1% and 10.0K respectively. I suppose such low expectations leave some room for an upside surprise, as we’ve already seen this year. If my guess was right, we would see a pullback down of the loonie to the zone 1.2750/2800. Technically, 1.2900 seems to be strong resistance level. MACD bearish divergence is not worked out yet. RSI14 is pointing to reversal.


Let the profit be with us!


____________________________________________________________
If you are interested to get more fx market analysis, please contact author:
email: lucas.tyler.ssfx@gmail.com
WhatsApp: +380931328731


Sunday, November 26, 2017

Where is the world going to?

I do not believe in money. Money do not exist, in my opinion. I believe in the air I can breath, in the sunshine, giving life to this planet, in water, in trees and so on. Money exist only in people’s minds, it’s an illusion. But at the same time, I believe in a fact that the majority of people I know believe in money. And it allows me to buy the products they produce and the services they can provide to me for something which is very abstractive to me.


I’m sincerely jealous to people who lived in ages, when the money was real. Made of metal: gold, silver, bronze, etc. It’s something hard, you can touch it, you can feel something heavy in your pocket, or a bag. Now people say a phrase: “I prefer hard cash”. I understand what they mean especially when it is compared to some electronic money (card, e-wallet, which are also illusions by the way). But the cash they talk about is not hard. It’s soft! it’s made of paper!! I guess it was very hard for people who got used for metal money to switch for paper money. I think, they needed couple of generations in order to get used for the new illusion.


Now we have cryptocurrencies. Wow. Money issued by someone else, not central banks. Does they have any difference comparing to other electronic money you usually send from one credit card to another? No. Same stuff. But the idea is great. I mean I can imagine myself waking up in a cryptobed one wonderful morning, going to a cryptoshower, wearing a cryptoclothes. Then I leave my cryptohouse, get into my cryptocar and drive it to my cryptooffice. Haha. Thanks God, they did not invent cryptofood and crytosex yet. But give them some time, you will see this stuff much sooner than you think.


OK, jokes apart. I open my trading terminal and see that people pay $9000 for one Bitcoin. Sorry, for one what? Ohh, a unique sequence of bits and bytes encrypted by very strong computer algorithm. I see, $9000 for algorithm. What was the price for it in January 2017? $900 approximately. Good. I’m asking myself one more question: what are fundamental reasons of such a price action? 1000% in 11 month it’s not a joke. - They say that it’s very easy and cheap to send this cryptocurrency abroad, it’s safe, secure and anonymous. Cool. Does it convince me to keep all of my free resources in this cryptostuff? No, thanks. I prefer hard cash.


I’m not a long term-investor. I’m a speculator. Short-term. The longest period I held one position was 5 weeks. I buy cheap and sell expensive. I open my positions with odds 80-20 and I risk my money with 30-70 ratio. Having 80-90% of profitable positions, I’m in the plus at the end of the week, month, year… I have an opportunity to sell an asset without having it. I can by an asset without physical supply. I’m interested in a Contract For Difference. I have a leverage 100:1 or more to boost my profits, without a need to put big amount of my own money to the market. This is how I make money, which I do not believe in.


I do not care about what asset should I trade on. When I see good odds for any currency to appreciate comparing to other currency, I just buy it. And vice versa. Some of top brokers, like Avatrade started to offer the possibility to trade Bitcoins and other cryptocurrencies. The leverage is not huge, just 20:1 so far, but anyway it’s better than 1:1 when it comes to buy-and-hold traditional strategy. Moreover, I have possibility to short cryptocurrencies and the markets are open 24/7. Someone will say: Lucas, are you crazy? Everyone buys Bitcoin and you are going to short it? - Yes I am. Look at the chart. The laws are the same, despite the rush and complete bullish sentiment. There are pullbacks on profit-taking or bad news disappointment reaction. The emotions are the same as well: it’s the fight between fear and greediness. You can see sell-offs in May, June, September and November. The only question I have about the next sell-off (pullback, retracement, call it however you want) - when is it going to happen. I have a suggestion that now BTCUSD bulls will try to get the prices to magnetic psychological rounded number. Notice, how it looks like: “$10000 for 1 Bitcoin”. I suggest a sell-off right after that. I think that such a seasonal factor like Christmas could also have an impact or a trigger. The idea is that lots of people who invested in Bitcoin during this year will want to take at least partial profit and turn it into something real. Christmas is ideal time for that, isn’t it?

Once the dust after the sell-off will settle down, I will buy it again...


Let the profit be with us!


____________________________________________________________
If you are interested to get more fx market analysis, please contact author:
WhatsApp: +380931328731

Four reasons, why we turned short on GBPAUD.

First of all, as you can see recent price action in major currency pairs, there is a quite tight range recently. Not much of the volatility, which the best friend for any currency speculator. At the same time, cross-rates, like GBPAUD move in a more rapid way, giving more profits at the end of the day.

Next is about the fundamentals of British Pound. We continue hearing the same mantra from UK officials: Brexit, Brexit, Brexit… European financial companies have withdrawn GBP350Bn recently due to the UK leaving the Eurozone. Irish prime minister has expressed concerns about UK government uncertainty in a very simple question, like what is going to happen with the border between Ireland and United Kingdom. Bank of England Governor, mr.Carney reminds about the uncertain impact of Brexit for the economy every time he hosts press-conference. Even hawkish rhetoric of MPC does not help pund bulls to break through the recent range. As a result, the sterling has lost it’s usual attractiveness for currency traders. I remember the times, when GBPUSD used to move 2-3 hundred pips in a day, leading the volatility among majors. What do we see now? Tight range. Yes, We’ve seen a pick up in the momentum of GBPUSD last week, moving above 1.33 figure, but will it have a sustainable continuation? We have doubts about that.

Meantime, the second component of the cross-rate GBPAUD, the aussie (AUDUSD) shows signs of finding the bottom after the recent depreciation, failing to break below 0.75 figure and pulling back above 0.76 in past week. Among fundamentals, supporting the pair, we can observe prices of metals exported by Australian economy: iron, silver and gold. RBA Governor, mr. Lowe, had hawkish comments this past week, saying that the next rate move will be more likely up rather than down, despite concerns of low inflation and weaker consumption. Traders will watch Manufacturing PMI from Australia and China this coming week.

One more reason, why we decided to take profit of mid-term longs, is technical outlook. You can find our chart setup below. We’re obviously approaching strong resistance range and there should be enormous demand for the GBPAUD in order to break through this range in a sustainable way. So, we’re expecting the pullback and consider shorts.   


____________________________________________________________
If you are interested to get more fx market analysis, please contact author:
email: lucas.tyler.ssfx@gmail.com
WhatsApp: +380931328731


Black Friday breakout?

Long weekend in US due to Thanksgiving day. Black Friday with queues to stores, discounts and sales. Retail companies’ stocks surge on Wall Street. Who trades currencies these days? Fx market has been thin with very low volume of trading. But this is very good time for miracles. These conditions allow big sharks like hedge-funds and other pirates to move the market, cause this task becomes much easier. We’ve observed a sharp movement in some assets during Friday NY session, right before closing the trading week. And the biggest question about that movement is: What was that? Profit taking? Was it a try to shake out the market and move it out of the tight range we’ve been seeing recently? Or maybe it was a try to touch water in the scope of the volume of orders placed above certain technical levels? Let’s try to figure out.

First of all I mean EURUSD. The most traded currency pair surged 0.68% on Friday without any significant economical report, closing the week above 1.19 level, first time in two months. Someone will say that Fed officials drove the pair by expressing fresh concerns regarding low inflation in US. But is it really new thing to the market players? Don’t think so. Someone will say that it’s about the US treasuries yields adding 0.7/1.0% on Friday and,thus, lowering the demand for credit capital flow. Investors in this segment have more risk appetite recently and they turn their attention to more attractive assets out of US. Such a bullish sentiment comes from stocks, which are already expensive. But despite that fact, leading worldwide indices continue attracting buyers. One more confirmation comes from safe havens. Look at the prices of GOLD, they pulled back from highs around $1293, failing to test important psychological level of $1300 per ounce.

Technically, the daily EURUSD chart below is bullish. MACD lines have wide spread and both moved to positive territory, pointing for further highs. RSI is above 50% level in a sustainable way, but rather far from overbought extreme levels yet, leaving the room for more appreciation. The prices have three daily closings above SMA89 in a row, confirming bullish market sentiment. Next pivot point is 1.2033 and we need to see a sustainable daily close prices above local highs posted on September 8th in order to see the continuation of the uptrend. No shadows, no tails, no whipsaws. CLOSE daily price. I would recommend to look for pullbacks intraday to those who missed this northwards movement and who wants to join the party and jump into the outgoing train. My long-term target of $1.25 for one EURO remains in play and I hope to see it before the end of the calendar year.

Very interesting picture I see on USDJPY daily chart. There is a bullish Doji Star formed last Thursday. It is a very strong reversal bullish signals, especially when it comes to japanese assets. I mean Japanese Candlestick Patterns must work with Japanese assets in the best way, otherwise they would not be invented there. Yes, the prices are still inside the span and the lines of Ichimoku are not in a right order for bullish continuation, but we can see first signs of reversal thanks to the latest upside Friday price action. Look at the green line, it has reversed and crossed the brown line, which could be a sign. Preliminary, but sign. First target to confirm my suggestions is to get out of the could (slightly above 112.00 currently) and accomplish the reversal pattern by a cross of blue and brown lines. In this case we could see a comeback of USDJPY to normal recent range 113.50/114.00. But please do not ask me when is it going to happen…

As you can easily guess, one of the most attractive pairs to trade with remains EURJPY. And the main reason is because fundamentally it does not depend on what is going on with the US tax reform, congress vote, political concerns and President’s tweets. Diversification, if you will. European economy continues to show strong performance and remains one of the most attractive marketplaces for Japanese investors, exporting the capital. Technical analysis of EURJPY confirms the fundamental attractiveness of the pair. First of all, the prices got out of the cloud after two failed attempts to break the bottom of the span (November 20 - lowest local prices). Secondly, the Friday bullish candle managed to close above both lines of the Ichimoku. Thirdly, daily close prices (113.08) are above local high from November 02 (113.00). The strategy is the same - buy dips. Targets: 113.85 and 134.37 for the nearest future, and 136.00 Yen per one Euro for the upcoming weeks.

The upcoming week is full of important economic events, in contradiction with the previous one. Among the headliners are British GDP and manufacturing PMI, US Consumer confidence and GDP, Chinese Manufacturing PMI, German unemployment and Manufacturing PMI, Eurozone GDP together with GDP and unemployment for Canada. Getting ready to volatile trading week especially in the scope of upcoming Fed meeting and rate decision. The odds for another rate hike are very high, so any possible disappointment could drive the greenback much lower.

____________________________________________________________
If you are interested to get more fx market analysis, please contact author:
WhatsApp: +380931328731


Saturday, November 25, 2017

About me and this blog.

Hello everyone!


My name is Lucas Tyler, I am an independent private Forex trader and analyst with experience more than 8 years on the market. Like many other traders, I have gone unique tough and painful way of education and understanding the markets before becoming a profitable professional. I remember how hard was that path, so I decided to share the experience and knowledge I gained during these years of trading on Forex. Profitable trading is my passion and main source of income. Making right predictions gives me enormous pleasure.


At some point I decided to go public and share my ideas with everyone interested. This blog is my first step, I will continue working on this project. My next step is to create an educational course, special website etc. So stay tuned for updates.


I have joined a community of traders - SS FX Management - with different trading strategies and unique points of view, but we’re on same page in one aspect:


Trading FOREX is our life.


We decided to stay completely apart of any efforts trying to convince you to start trading. If you did not know who you are, FOREX would not be the best place for self-identification. If you are already a trader or if you plan to start, then you’re welcome to join our community.


My market analysis and trading views have more recommendatory character. You do not have to agree with everything I say or do here. Markets are full of opportunities to make money with completely opposite opinions and sentiments, so we do not insist on being the final instance of truth. You are the person in charge of your money, you make the final decision to pull the trigger and you are the only person responsible of your trading account statement at the end of the day.


I have several support packages suitable for both demo- and real-account traders. You may gain the experience money can’t buy, exploring our analysis, decisions and explanations in real time conditions. Deep understanding of fundamental market drivers will help you to look at the events with a bigger scale. Technical analysis will help you to determine right levels to enter and exit the market. Healthy scepticism observing different events will help you to avoid market traps. Financial markets are like a huge ocean with enough space for everyone who wants to take something from it.


I am profitable trader and I want you to be profitable. Welcome to the club!


____________________________________________________________
If you are interested to get more fx market analysis, please contact author:
WhatsApp: +380931328731

2017-NOV-02 USD deep FX outlook

Please note, that this article comes from my archive. Check the actual date in the header.

FOMC stands on-hold on Wednesday meeting, as widely expected. There were no press-conference to follow the decision, only statement, which was slightly hawkish, indicating “solid” economic growth of the economy operating at a tight labour conditions. Nothing new. The December rate hike is almost priced in by the markets, odds are above 90% currently. Not much of the reaction in FX market. The price action leaves an impression like everything positive is already priced in and something extraordinary is needed to move the greenback higher. Three key events to play such a role this week: Trump’s decision about the next Fed Chairman (not Chairwoman we hope), House Republicans to release the tax bill, and NFP report.

The US Dollar Index, which measures a basket of six major currencies versus the greenback moved slightly higher yesterday (+0.2%), but this movement was before the Fed rate decision with not much of the reaction after the statement release. At the same time we observe traditional bullish trend in all US stock indices following strong earnings reports and sustainable demand for US treasuries. Our confidence in these markets is much higher than in ability of the greenback to continue the reversal pattern and turn into a strong bullish trend. The reason is related to the current difficult situation in “Trumpflation” as they call it.

First doubt is about the possible effect of the upcoming tax reform. Some analysts note that it would not have much of the impact for economy, slightly changing the situation for the middle class and not adding any pressure on extremely rich individuals in USA. But the Federal budget would face a problem, seeking additional $6 trillion over next 10 years. Add here the negative trade balance and huge external debt of the biggest economy worldwide. One of the fastest and most obvious ways to solve these problems would be to keep raising the interest rates, creating additional demand for the treasuries from both internal market and overseas. But there is no much inflation to have a traditional explanation of the tightening. The economy operates with historically low unemployment but wages and consumer spending to not grow. One more puzzle in this picture is the most probable candidate for the Fed Chair: Jerome Powell, Fed Governor, known as a dove (??).      


The main economical event for the week is US October Non-Farm Payrolls report. We would not rather high expectations from the market: +314K according to Investing.com and +325K according to bloomberg.com. There could also be a revision of the September reading, which was negative (-33K). ADP report was strong this week, posting +235K. But this agency has a different methodology counting the payrolls, and it’s not always coming in line with the official report. So we expect the figure to be released most likely closer to the lower range of the expectations: somewhere around +200K.

We also think that the NFP report itself is not the main figure to watch tomorrow. Much more interesting will be the Average Hourly Earnings, which has direct impact to the consumer spending and, thus, inflation. We’ve seen the pickup in September (+0.5% MoM vs +0.2% expected and +2.9% YoY vs +2.7% expected). The odds for more rate hikes next year will definitely rise in case of the strong reading tomorrow. The market expectations are in the range of 0.0/0.5% and 2.7/3.1% respectively. We’ll cover the NFP report tomorrow in our live trading session. Must watch!

Technical picture of the USDX is mixed on the weekly chart. The rates went back to the horizontal channel, where the index traded in 2015 - 2016 after a short time break down in September 2017. We can see a pullback from the lows of this year, but we have doubts about a long-term reversal pattern to be completed. RSI14 is still bearish trading lower than 50% level. As long as the prices are lower than 50-weeks simple moving average, the downside long-term risks persist.

DXY W NOV02.png

One more interesting asset to analyze in the scope of dollar index and US yields: GOLD. We’ve seen a strong bullish trend in August-September 2017, which was stopped by hawkish Yellen, driving the yields higher and limiting demand for safe-haven gold speculations. Gold futures have been bearish since September, 8th. But we see potential signs of bullish reversal recently. Daily chart below shows two failed tests of lower Bollinger Band with closing prices inside the range. Upside red line supports the rates from further decline. RSI14 indicates bullish divergence.

We would consider mid-term longs of the gold using a buy-and-hold strategy. Any possible disappointment in “Trumpflation” dilemma described above could lift the prices of gold much higher from current levels. Geopolitical tensions are also adding potential risks for a flight to safety. US President has a trip to Asia starting from Friday, and one of the main goals of this trip is to solve the North Korea situation. Who knows what is he going to tweet during this trip?

GOLD D NOV02.png

Nearest technical targets for longs of gold are 1303.10 (upper BB range) and 1317.10 (local high from September 26). We are ready to add more longs in worse-case scenario if the prices went lower, heading to long-term support level of 1250.00 dollars per ounce.

Another precision metal, which traditionally follows gold, is silver. It has much higher margin requirement, but pays-off with the higher volatility. Daily chart is much more bullish than gold with more room to go north. Yesterday price action was impressive, adding 525 pips of the profit in the first day of November trading statement. Next target is 17.489.

Let the profit be with us!

Please note, that this article comes from my archive. Check the actual date in the header.
____________________________________________________________
If you are interested to get more fx market analysis, please contact author:
WhatsApp: +380931328731


2017-OCT-24 USDCAD deep outlook

Please note, that this article comes from my archive. Check the actual date in the header.


One of the most important events for the rest of this week is going to be Bank of Canada meeting on Wednesday at 10:00am EST (16:00 SA Time). We have both the rate decision and press-conference. ‘Loonie’ traders will have a close watch of the event in order to understand the future of the regulator policy and direction of USDCAD trading for the next months. We’ve seen two surprising moves from BoC this year. The central bank hiked rates 25 basis points without any preparation of the market participants which saw traders piling into Loonie speculative positions and 250 pip spontaneous move. Dandy Catch suggested the possibility of such a move and to get short USD/CAD which paid off handsomely.


On a long term basis, Dandy Catch Analyst team has been in and out of short USDCAD positions since March 2017. The pair slide more than 1700 pips in period of May - September. The  Canadian Dollar showed strength without any support from crude oil prices, which are traditionally crucial for the export-oriented Canadian economy. The main driver of such appreciation of the Loonie has been surprising strength of the economic reports together with a broad weakness of the greenback. BoC has been one of the first central banks to start the tightening cycle, leaving behind the period of unprecedentedly low interest rates. In this way they ‘lead the pack’ of central banks heading into 2018 and should continue to be watched closely.


There is one more reason why BoC officials move so fast relative to their peers. It’s not the first year they have a possible bubble in the housing sector. There is a certain cautiousness about too much pressure for the banking system due to a huge volume of mortgages. BoC has to be ready to react for possible shocks to the economy and there is no other instrument to do so other than interest rates. They hike with readiness in order to have the capability to cut in the worse-case scenario. And there is a big question about the current rate 1.00% rate: is it high enough for future cuts to be effective?


Taking such a view into account, we would not be surprised for another rate hike today, although the likelihood currently stands around 20%. Expecting the unexpected is a part of our job. Market participants do not price in a rate hike completely and if it happened, the USDCAD could move southwards very sharply: 200-300 hundred pips in several hours right after the decision. So there is an aggressive trading strategy for those traders who can afford a loss of 50-100 pips targeting 200-400 pips of a possible profit: short USDCAD 5 minutes before the rate decision, put a stop-loss order in a range of 50-100 pips above the price and be ready to close the position manually in case if there is no rate hike. Maybe even reverse depending on market reaction and rates momentum. A slightly more conservative approach would be to wait 5 minutes after the announcement after knowing the rate decision firmly and then short USD/CAD (only in the event of a rate hike). In the event of no rate hike, a bullish continuation in USD/CAD looks more probably and likely good for no less than 50-75 pips to the upside. A nice catch for a trade likely to be held under 1 hour.


Similar to the ECB rate decision tomorrow (which we are covering live for ‘Premium’ DandyCatch members), we can see a whipsaw so we do need to keep our wits about us and not be drawn into a position in reaction to sheer volatility alone. This is a key reason why being tuned into the DandyCatch ‘Live Trading Event’s is so valuable. An analyst is right there with you to guide you and help increase your knowledge quickly on how to trade such events.


Technically USDCAD is bullish on most timeframes. The only bearish exception is the monthly chart, which has very slow reaction technical indicators. The weekly chart turned bullish after breaking below long-term SMA200 (1.2506 currently) first time since May 2013. MACD histogram turned positive, the lines crossed to a bullish mode. Fast oscillator RSI14 is back above from oversold territory, but still below 50% level indicating possible bearish continuation in case if the rates failed to close the week on a strong momentum above 1.27.
USDCAD W OCT25.png


The daily timeframe has a possible bullish reversal ‘head-and-shoulders’ pattern on daily chart with 1.3024 as first potential target.   USDCAD D OCT22.png
Another view of daily technical chart is below. MACD is bullish with the lines enlarging the distance between each other, RSI is bullish heading to overbought territory first time since May 2017, ADX is positive with much of room to go up. First resistance would be Simple Moving Average with 200-days period (1.3014 currently). Be aware that Stochastic RSI is already extremely overbought.
USDCAD D OCT25.png


There is a more mixed picture on H4 and H1 timeframes, indicating a wait-and-see sentiment of major market players. The rates are stuck in a tight range slightly below local resistance of 1.2700 level without much of the volatility on the table. It looks like the usual calm before the storm.


Assuming all said, there are two possible scenarios and trading strategies: aggressive shorts right before the BoC decision (high risk) and conservative mode to wait-and-see, joining the party after getting a complete confidence of the market direction. This is the more advisable approach. Long USD/CAD positions are preferable in case of an on-hold BoC decision. All traders should remember about risk management rules before pulling the trigger.


Let the profit be with us!


Please note, that this article comes from my archive. Check the actual date in the header.
____________________________________________________________
If you are interested to get more fx market analysis, please contact author:
WhatsApp: +380931328731


2017-OCT-23 EUR deep outlook

Please note, that this article comes from my archive. Check the actual date in the header.


The main event for the financial markets this week will be ECB meeting on Thursday. Political uncertainty from Spain and mixed German elections on one hand and strong economic reports on the other, will force ECB Head Mario Draghi to face a familiar position. Is he going to lower the amount of ECB asset purchases by 20B EUR or more? Would he express his concerns about possible EURUSD rates above 1.20 as the result of such a decision? Or will we see him take a soft stance and postpone the decision which market players large and small have been anticipating.


Many economists, including Paul Krugman, the recipient of the 2008 Nobel Prize in Economics, talk about the potential risks to the worldwide economy related to the unprecedentedly low interest rates of many central banks worldwide. It is understood that maintaining low rates is an effective tool at keeping your local currency as weak as possible as well as benefit the exporters in your local market. At the same time, the depressed interest rate situation is not giving central banks an opportunity to react to any possible shock to the economy. Central Banks do not have any room for maneuver unless they want to take interest rates negative - in which case it can decades before you turn back. Take a look at Japan as a case study in the subject who have had negative or a near zero interest rate level since the 1980’s. The European Central Bank is not an exception either if they are not careful.


On the bright side, we have been observing sustainable recovery from the Eurozone economy recently. Manufacturing, Industrial Production, Consumer Confidence, Retail Sales, Employment, - all figures have been in the green for months. Market players are expecting the initiation of a tightening cycle from the ECB, pricing in additional speculative demand for European assets and thus greater demand for the Euro. Remember, despite the recent USD bounce, EUR/USD has been in an uptrend since spring 2017, adding 11.5% versus US Dollar. However, one of the main economic factors monitored by the ECB, inflation, is still below their target. Very similar situation to the United States in regards to inflation. September YoY CPI report posted 1.5% last Tuesday, exactly in line with the expectations. This is the first solid justification of we can expect the ECB to stay on hold not only with rate hikes, but with quantitative easing as well.


Few economists expect a rate hike from the ECB this week. The chances are extremely low. The main question is about the ECB asset purchase programme. The official ECB website says: “Monthly net purchases in public and private sector securities amount to €60 billion on average. They are intended to be carried out until the end of 2017 and in any case until the Governing Council sees a sustained adjustment in the path of inflation that is consistent with its aim of achieving inflation rates below, but close to, 2% over the medium term.From April 2016 until March 2017 the average monthly pace was €80 billion while from March 2015 until March 2016 the average monthly pace was €60 billion.”


We see two possible scenarios for the upcoming meeting. The first and more likely one is with a hawkish tone. In case if ECB lowered the QE programme by EUR 20B or more, the EURUSD would soar. The main reason is that this decision will increase Euro bonds yields, creating lack of cheap resources supply and open improved access to the ECB credit market for foreign investors. These factors would definitely create an additional demand for EUR, and we would not be surprised to see our medium-term target of 1.2400 USD for EUR/USD sooner rather than later.


The second scenario is more dovish and also possible. Mr. Draghi told the markets in the last meeting that in October he would give us something significant which is why we rank this likelihood less than the ‘hawkish’ scenario. A dovish scenario would mean that the ECB would not make any changes to the current situation and postpone the rate decision again. In this case we would see more selling pressure on EUR, especially versus the US Dollar.


We would prefer to remain out of positions until after the decision and press-conference on Thursday due to strong chance of a whipsaw in the market which we often see immediately following such central bank decisions. Being in a position during a whipsaw tends not to benefit bulls or bears as both can be shaken out of their positions before having an opportunity to capitalize on their market stance. There will be plenty of profit opportunity post the decision and the wise risk management approach says to be patient. The best trading strategy is to closely monitor the market momentum right after the meeting and during the Draghi’s press-conference. Traders should pull the trigger once there is clarity around the feedback in the press-conference which often isn’t garnered until at least 15 minutes after the rate decision.


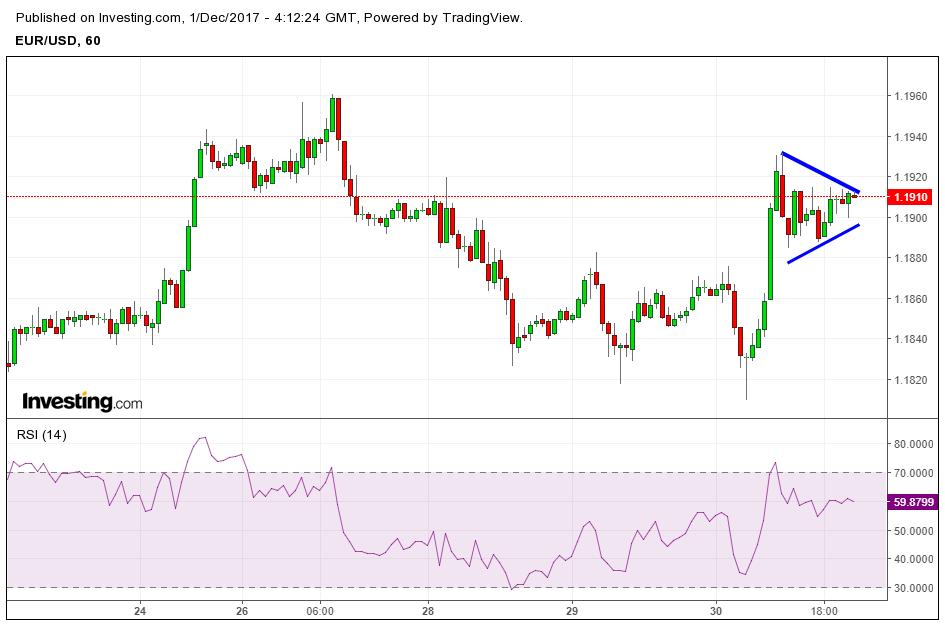
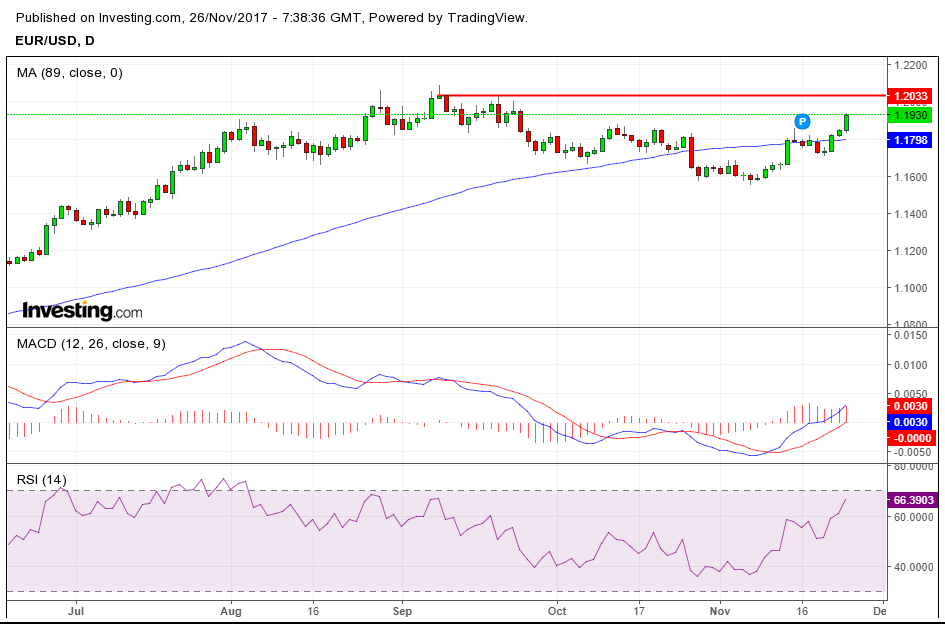
Technically, the EURUSD picture on the daily chart is mixed. Both slow MACD and fast RSI indicators are in bearish territory, while the prices are below the 6-month uptrend median line (green dotted line). However SMA89 (blue line) still supports the current price levels. We would indicate a long-term support level around 1.1680/60 and it would be important to see the pairs’ behaviour at this level if it tests it before the ECB decision on Thursday.


EURUSD D OCT23.png


There is a completely different situation with EUR cross-rates. One of the most attractive currency pairs for long-term investors remains EURJPY. Asian investors traditionally export capital in all segments: credit, equities and speculative sectors due to the strong support from Bank of Japan’s negative interest rates. The pair already added 16.2% during last 6 months and looks set for further gains. We would see our November target around 136 yen per Euro earlier than expected and even as soon as this week.  An additional fundamental factor to drive EUR/JPY higher is the growth in USDJPY, which has bounced up last week.


Technically, EURJPY has shown signs of ending the retracement we observed during the last three weeks after failed attempt to break through resistance levels around 134.30. Our Ichimoku Cloud indicator is bullish, with the ‘span’ increasing the range, all of the lines are in order for uptrend continuation and the rates posting new local higher highs.
EURJPY D OCT22.png
 
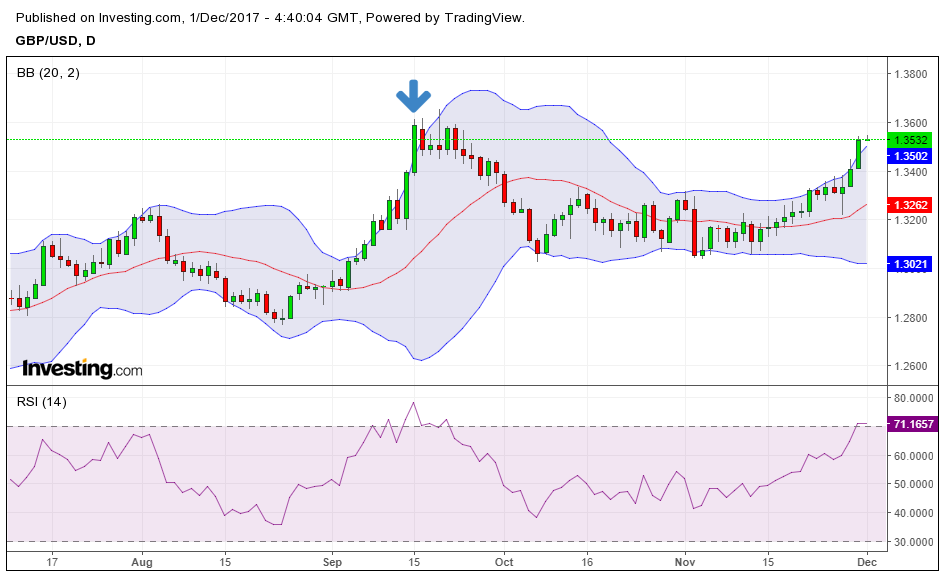
Another cross-rate to watch is EURGBP. The British economic reports had a disappointing reading last week, forcing the Bank of England MPC to put on hold the hawkish rhetoric. Technically, EURGBP has targets slightly above 0.90 for the nearest term. We could see an other test of 2017 highs above 0.93 after the sustainable break of 0.9026 resistance. One of the main fundamental risks for the pair will be UK GDP reading this Tuesday. We’ll keep a close eye.


One of the most lucrative currency pairs to trade currently is EURNZD. There is a huge fundamental divergence between two economies. RBNZ officials do everything they can to lower the Kiwi and they get support from the stronger greenback. NZDUSD slips lower than 0.7000 psychological level last week, for the first time since May 2017.


EURNZD surged almost three hundred pips in one single day on last Thursday’s trading session, the highest daily gain since early 2016. Technical targets are above 1.7200 level, leaving more opportunity for upside movement, especially in the hawkish ECB scenario.
   EURNZD D OCT22.png


We can see EUR supported with the cross rates, having more mixed and uncertain picture versus the USD. The best strategy remains to buy-dips for EURJPY, EURGBP and EURNZD intraday with low volumes and tight stops, while it would be better to avoid trading EURUSD before the ECB meeting and press-conference scheduled for this Thursday.


Please note, that this article comes from my archive. Check the actual date in the header.
____________________________________________________________
If you are interested to get more fx market analysis, please contact author:
WhatsApp: +380931328731


Don't try. Do. Action is something that brings you to the next level. You should keep in mind that no thought, no word can enhance your ...