Monday, January 15, 2018

GBP/NZD reversal?

We’ve been short on GBP/NZD for several weeks, and this position has been lucrative. The arguments were posted here a while ago. But it seems like we’re facing a reversal opportunity and here is why.

As every other cross rate, GBP/NZD has two components: GBP/USD and NZD/USD. The direction of the cross rate is determined by the difference of momentum in one of the components related to the greenback. For example, one pair could rise faster than the other one and this difference creates pressure on the cross. Sometimes the components can diverge, meaning that they can move in opposite directions. In this case, the momentum of the cross rate accelerates and it moves rapidly.

Let’s try to analyze the latest performance of both components. NZD/USD has been going north for several weeks in a row, without any significant retracements. There has to be a retracement sooner or later, does not matter about further direction. We’ve got one of the first fundamental confirmations, New Zealand Electronic Card Retail Sales in December has been released weaker than previous month.

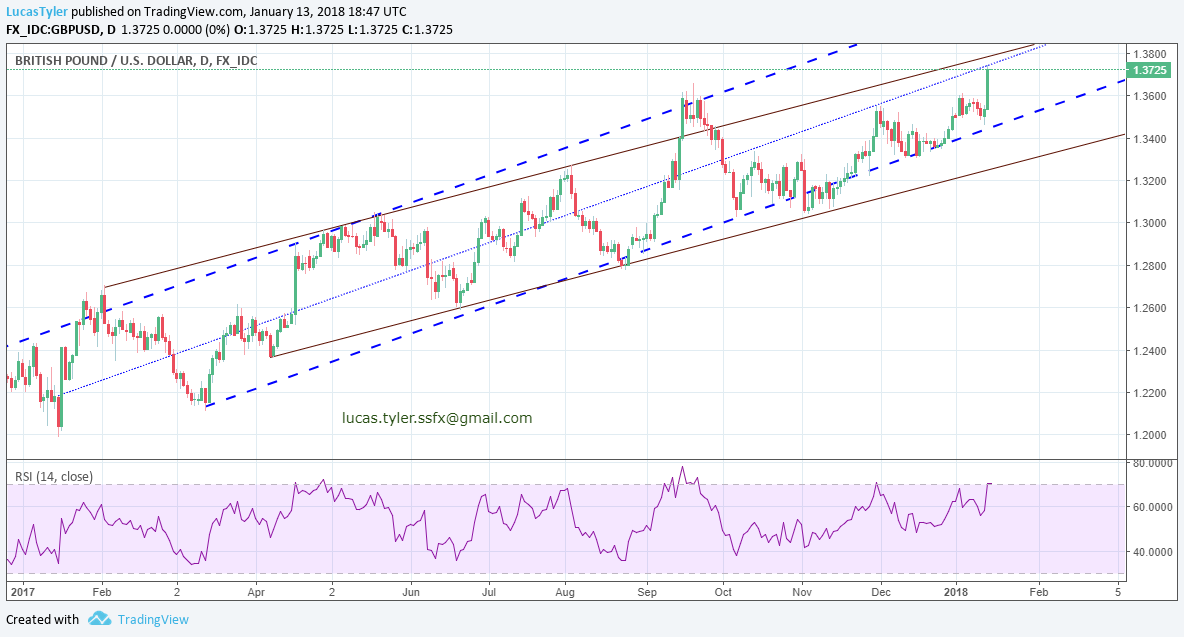
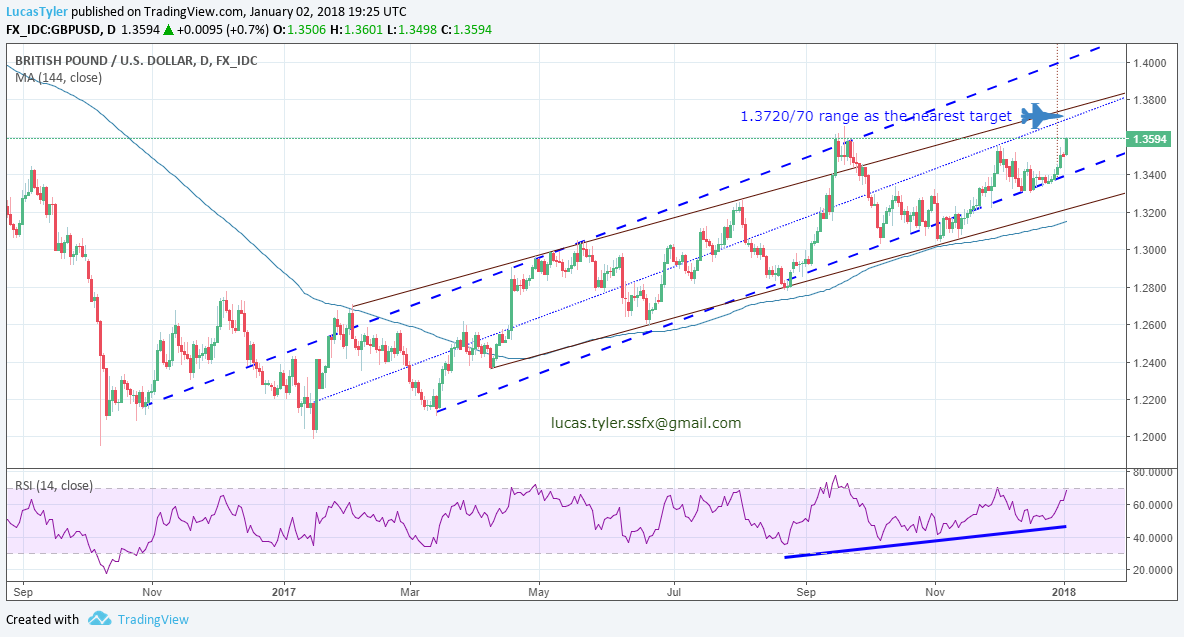
GBP/USD has more potential to rise without pullbacks. The pair has breached a level of 1.38000 on Monday, and there is no significant resistance until 1.39750 approximately. Fundamentally, there is a rumor from Britain about ‘softer Brexit’ deal with EU. Remainers camp has a majority in parliament now, so leavers cannot dictate their conditions any more. Of course, we need to get a confirmation from British economy. Inflation figures a scheduled to release today, on Tuesday and traders will be also watching the retail sales on Friday.

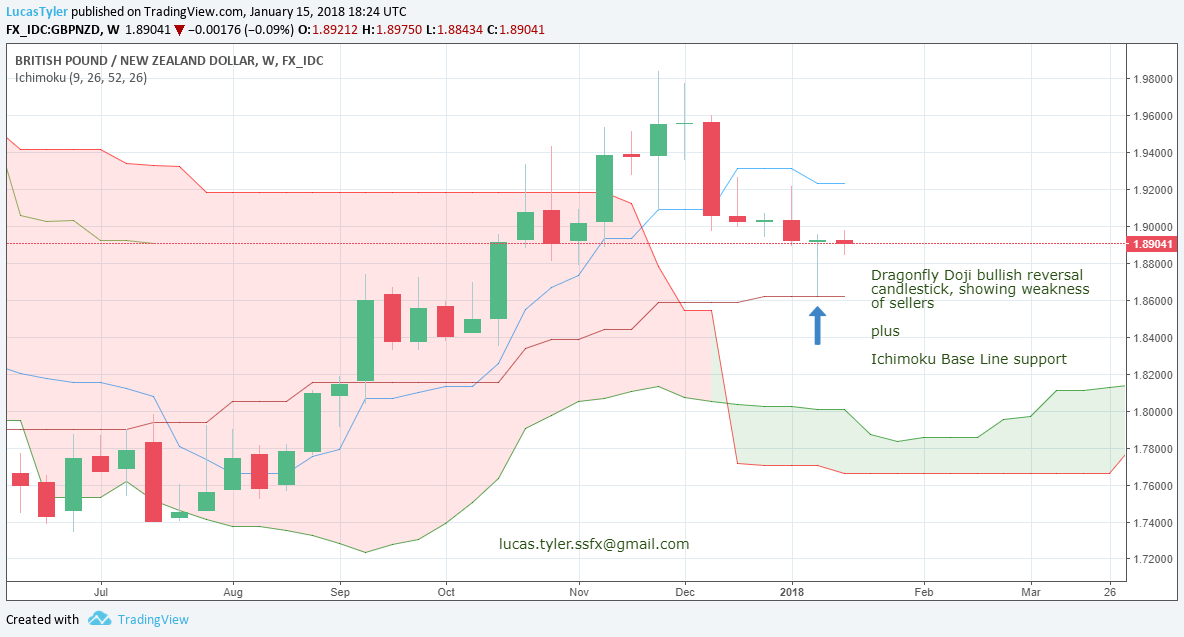
Technical background of possible reversal is illustrated below. We already went long on GBP/NZD yesterday, and all of our clients received these charts in time. So please contact us if you want to get fresh analysis in real time conditions.


Saturday, January 13, 2018

The cable is back

Latest several weeks were very positive for the british pound. It is exactly the situation when the best news is the absence of news. I mean no talks and no meetings with the allergic topic by the name of Brexit. The next week has some important economical reports though: CPI and PPI on Tuesday, Retail Sales on Friday. These reports will be a real test for the sustainability of the latest cable’s bullish achievements. In case if bulls could get a support from that side, BoE would face a stronger pressure about faster tightening, leaving the regulator not much of the choice rather than to react in a proper way. Brexit mantra won’t help any more. On the other hand, politicians could turn on the agitation machine and keep fighting with reasonable fundamental price of GBP/USD in order to push it lower. Anyway, the only thing that we can guarantee about the next week is higher-than-usual volatility.

Technically, the pound breached long-term resistance and is heading to pre-Brexit levels. Our subscribers have seen a chart like this two weeks ago:

The blue plane indicates the range of 1.3720/70 as the nearest target. Guess what is the closing price of this week? 1.3725 with the highest rate at 1.3744. By the way, guess when was the last time we’ve seen such rates of the GBP/USD? -Yes, 2016-06-23, the day after Brexit vote. Is the cable back??

Below is the updated chart with the same setup:


The price did not get in the zone between the brown and blue dotted uptrend lines, but achieve the rate target. So the resistances remain in play with a high probability of a local retracement. How deep is it going to be? That’s a question for a million. The war will show us the plan. Intraday momentum plus fundamental environment will give us a clue when to pull the trigger. Do you want to join our profitable community? Feel free to contact us.

There are also interesting situations with GBP/CAD, GBP/JPY and GBP/CHF crosses, so next week promises to be very lucrative.

No choice but EURO

EUR/USD pulled back down in the first half of the previous week, performing a classic and healthy retracement before breaching important long-term resistance. One of the fundamental factors, except weakness of the greenback, was ECB publishing Account of Monetary Policy meeting. There was a tweak from the regulator, a rumor about possible tapering unwind. In a simple word, the Central Bank is preparing the markets for faster decrease of the cheap borrowed capital. This change in the policy should attract foreign investors to direct capital flows to the Euro Zone. Forex speculators reacted immediately.

We went long again on EUR/USD on Thursday at 1.19622 rate and held this position through the Friday’s US CPI report. A profit of 234 pips in 32 hours is enormous for this pair. Such a rapid appreciation tell about the only possible future scenario: bullish continuation. We already showed a long-term weekly chart and we already spoke about the importance of 1.2100/2200 resistance range in one of our previous posts last week, so we do not see any reason to repeat ourselves. What’s next? ECB Inflation report scheduled for next Wednesday. CPI (YoY) is widely expected to remain at the same level at 1.4% in December. So any positive change for even 0.1% would give a lift for the pair to continue posting fresh highs. Stay tuned for our intraday analysis to determine the best level to join the party.

U.S. Dollar post-NFP collapse

The Non-Farm Payrolls report gave a temporary support to USD bulls. The main factor - earnings growth, released in line with the expectations 0.3% in December. Despite the weaker-than-expected NFP, U.S. dollar kept gaining against the majority of currencies in the first half of this week. But the growth has been stopped on Wednesday and we observed not only reversal on Thursday, but a complete crash of the world reserve currency on Friday. The main fundamental reasons were: sell-off in U.S. Treasuries, Chinese threats to stop buying bonds, traders’ and investors’ skepticism about Federal reserve ability to hike three times as they penciled during last meeting. Even stronger-than-expected Core CPI (0.3% MoM and 1.8% YoY) did not help. We’ve seen an epic battle between bulls and bears for important levels and complete defeat of bulls as the result of the week.

USD Index lost 1.26% of it’s value this week and Friday’s decline was 1.03%. Frome the technical point of view, the index broke through important supports. The first one is a local support, which used to hold the intraday prices from falling further during two weeks (blue horizontal line), and the second support is the mid-term lowest daily close on September, the 8th, 2017 (green horizontal line). As the result we have lowest value of the USD Index in three years. The daily chart is illustrated below:


There is a simple technical rule: a breached support becomes resistance. So the brown downtrend line on the chart looks to be perfect to renew shorts of the greenback. Of course, if the market would give such a gift.

Thursday, January 4, 2018

New Film Promotion


Have you ever seen a new movie breathtaking teaser, which encouraged you to get out of your routine and run to a cinema? Wow, it’s so new, exciting and promising to change your attitude to the industry! You watch the movie and on 24th minute you realize that the story is old like centuries and scenario has been rewritten from something else… Nothing new except decorations.

Same here, on the financial markets. 
Several pieces of puzzle for you to observe.

November 2016. Donald Trump became President of United States. His election promise was: ‘Let’s Make Oil Industry Great Again!’. One of the first persons he picked up in his cabinet was ex-CEO of Exxon Mobil. The result of the team hard work is illustrated below:


Two impressive observations about this weekly chart. Firstly, +50% in six last months! The price is above highest close in 2.5 years! Secondly, look at the speed how fast the price moved through highlighted range $60.00 - $80.00 in 2014 during sell-off. Wow, 2000 pips or -25% in 7 weeks! My point is that we could see a mirror bullish run. Try to draw a right wing of this unfinished masterpiece, wouldn’t it be symmetric?

April 2017. French presidential election. Emmanuel Macron beats Marine Le Pen. Dejavu? A male candidate representing big money sacks beats a female with doubtful reputation. Or is it a new movie???

EUR/USD reacts immediately. Below is a weekly chart. The April weekend gap will not be filled for a long long time. Tell me please, do you think these lines are parallel by a coincidence? I will tell you, what is happening now. We are entering into new long term bullish channel. Nearest target is at least to come back to lows of October 2008 - February 2009. It is 1.25000. I used to short EUR/USD from 1.60000, so please don’t tell me that 1.25000 is very high level.


September 2017. Stanley Fischer, Federal Reserve System Vice Chairman announced his resignation, leaving the Board of Governors three months before Chairwoman Yellen term expiration. Official reason is ‘personal circumstances’. I translate his message: ‘I do not want to play your games, guys. The market will not buy this stuff’. October 2017. FOMC announced three rate hikes in 2018 despite the lack of inflation. December 2017. FOMC insisted on three upcoming rate hikes, US Dollar trashed:

Look also at US Stock indices, gold, other commodities and commodity currencies, emerging market currencies. You will see the same picture everywhere. Traders and investors are searching for any asset, not to stay in cash USD, which is losing its’ value due to the Fed policy.

Do you really think that NFP report today would change anything in this overall picture?..

The 
greenback's destiny has been decided a long time ago. 

The king is dead, long live the King!

Tuesday, January 2, 2018

Scared Little Bird, or How An Individual FX Trader Survives in Volatile Environment.

Sometimes I see the markets as jungle. Thousands of animals trying to find a way to eat each other. Some of them are big predators, hunting for their victims, the others run and hide. Everyone is hungry though, and the task is to eat some food, but not to become a food for someone. I imagine myself as a scared little bird sitting on a tree in a safe haven zone (squared). No predator can reach me here, but there is no food (profit) though. I’m watching what’s happening on the ground near this tree, trying to search for a piece of food. I realize that my biggest advantage comparing to big predators (hedge funds, institutional investors, huge banks) is the SPEED. I can fly down rapidly from my safe place on the tree, grab my piece of profit and come back to safety in a blink of an eye. So when I see volatility period is coming, I’m looking only for quick deals. If I understand that I’m stuck with a position for a longer time that I was hoping for, I just drop it and run away. Tight stop losses also are a must in volatility period.

What’s happening in the bush currently? I recall very similar period as it was in the end of August - beginning of September 2017. Same rally in worldwide stock indices led by historical highs in U.S. NASDAQ posted all-time high closing levels yesterday. Commodities have a bullish run with oil above $60 and gold above $1300. Euro is above 1.20. Most of traders are running to any asset, not to stay in cash (the greenback as cash here). Sell-off in USD. But suddenly a scarecrow is coming out from nowhere: “Nuclear war eyes on horizon! Run back into cash!” And some of the traders reverse their greed-on mode to fear-on. But the others wait behind the corner and buy what those sell. The only difference now is that two fat guys tweet each other, who’s button is bigger...

Allright, jokes apart, let’s be serious. I got nothing to do with nuclear war tweets, but ignore them. I’m waiting for FOMC Meeting Minutes to see the next wave of disappointment in the greenback. Fed is obviously behind the curve. Yellen tried to be hawkish in October and she had some temporary success with the greenback retraced from lows. But they had a tax reform positive expectations that time. What do they have now? Growing budget deficit, growing external debt and growing negative trade balance? Oh, yes, they also have a growing disappointment in the tax reform. What is an alternative way to turn the attention from these problems rather than to talk about nuclear buttons? So I expect nothing, but disappointment from the upcoming Minutes today.
We went long on EUR/USD again on the retracement yesterday, and we’ll be looking to add longs later today. But we keep in mind Scared Little Bird tactics, and our stop-loss orders are tight. A deep retracement is still possible, cause the upcoming NFP report could have rumors about strong employment in U.S. and could bring the greenback bulls some fresh air to breath.

Gold went big path in a very short period of time. Look at two charts of gold futures below. First one has been posted on December 19th, the second one is from today.


Almost 800 pips and almost +7% in two weeks!! What a run!

But they need a retracement if they want to proceed. At least the price needs to come back down to the last breached resistance around $1308.00/1309.00. Please note that I mean here Gold futures. The prices of CFDs for Gold are usually couple of bucks lower.

One more interesting observation is about the British Pound. Fundamentally, it’s been underpriced in my own opinion. Brexit mantra does not have such an impact as it was described by BoE officials. They only use it as the justification to keep the interest rates at low levels and compete on the external markets thanks to the currency slower growth comparing to others, like Euro for example.
But look, what’s happening nowadays? Sterling breaks some important technicals. Especially versus the Japanese yen. Well, we see it this way: a lot of traders got used to play ping-pong with the pound pairs. It’s very easy to sell it when it goes up and reverse on certain lower levels. But seems like someone big is trying to catch an additional haul to the nets, hunting for stop-losses, margin calls and traders who do not adopt for changed environment. You may see below two interesting daily charts of GBP/USD and GBP/JPY.


GBP/USD is back above 1.36000 as I write these words, second time since Brexit vote with the highest daily closing prices in the period. GBP/JPY is very close to breakthrough an important technical resistance, which held for a while with several failed attempts before. Will it stand this time? I doubt.

Aggressive intraday longs of these two pairs with a target of 100..150 pips could be a quick piece of food for the Scary Little Bird on the tree.


Monday, January 1, 2018

USD bears to control the first trading week of 2018?

The last trading week of 2017 was not packed with major economic events and reports. But despite that fast, the markets moved sharply across the board, posting several technical important achievements. EURUSD closed the week above significant psychological rounded mark of 1.20000. GBPUSD breached above 1.35000, spot Gold CFD prices are nearing $1300.00 per ounce, first time since early September 2017; Crude oil. WTI closed the week above $60.00 per barrel, first time in 30 month.

There are several explanations about such a weakness of the greenback. We already talked about some of them. Federal Reserve needs to much more hawkish and convince the markets before they will reverse back to bullish USD sentiment. U.S. stock are facing a period of uncertainty with more bearish emphasys in January, which also does not add support to bulls.

The upcoming week is full of important data to kick-off the start of busy 2018. Monday is traditional holiday in a lot of countries worldwide and very low volume of trading is expected with almost zero volatility. The markets players will be back to working places since Tuesday and start watching such reports as China Caixin, German, British and U.S. Manufacturing PMIs. Retail Sales from Switzerland, Germany Unemployment, British Construction PMI, U.S. ISM Manufacturing PMI reports will determine the trading sentiment on Wednesday before possible high volatility during FOMC Minutes to be released at 07:00 PM GMT. Thursday has a pack of data from Europe and UK and ADP employment change together with Crude Oil Inventories from U.S. European CPI, U.S. December Non-Farm Payrolls and Canadian unemployment on Friday will be among the main events of this upcoming week to determine trading direction for a bunch of assets on the financial markets.

It’s reasonable to expect high volatility with such a heavy economic calendar. But it feels like the bears have to have a break, renew strength and reload technical indicators whether by a pullback or sideway horizontal consolidation range. One of the first triggers to renew the wave of the greenback sell-off could be FOMC Meeting Minutes on Wednesday. So we prefer to have a wait-and-see strategy before that. Of course, we’ll be looking at some crosses for intraday trading opportunities.

U.S. Dollar Index is nearing to overbought levels. But the Bollinger Bands indicator signals a bearish continuation by closing the day below the Band. The daily chart is shown below.


Any retracements has to be considered as selling opportunities if the fundamental environment will keep disappointing investors and traders.

We will update the trading plan for this upcoming week and we will observe more currency pairs attractive for trading later. We are also going to host a live trading session on Friday’s U.S. NFP report, so stay tuned for updates.


Don't try. Do. Action is something that brings you to the next level. You should keep in mind that no thought, no word can enhance your ...