Technically, the pound breached long-term resistance and is heading to pre-Brexit levels. Our subscribers have seen a chart like this two weeks ago:
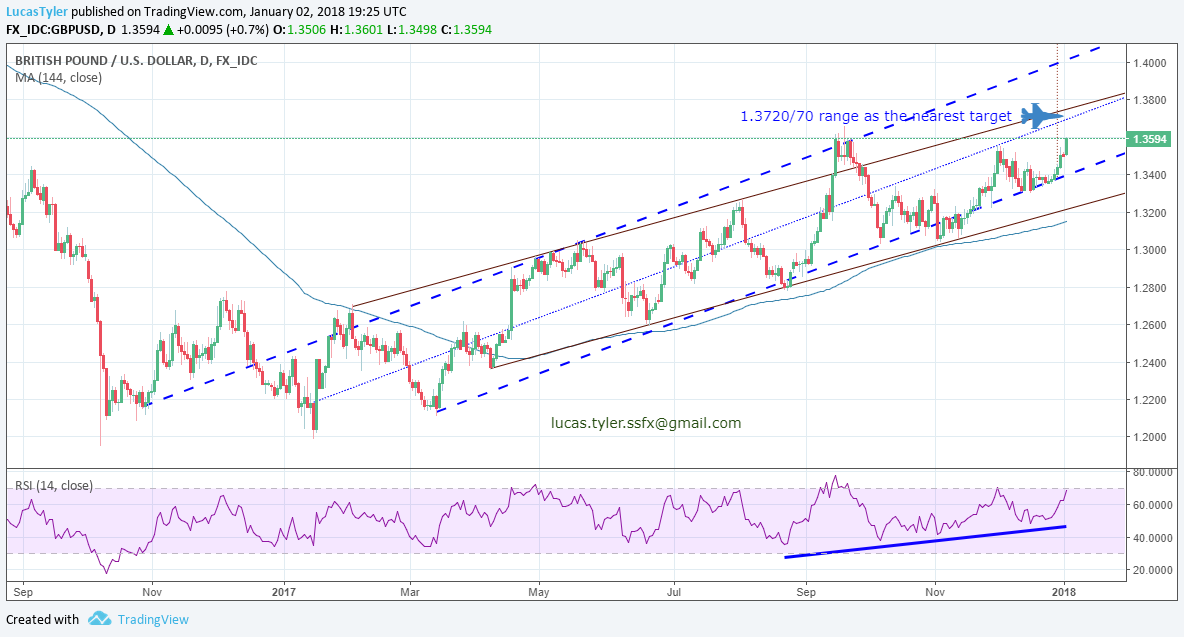
The blue plane indicates the range of 1.3720/70 as the nearest target. Guess what is the closing price of this week? 1.3725 with the highest rate at 1.3744. By the way, guess when was the last time we’ve seen such rates of the GBP/USD? -Yes, 2016-06-23, the day after Brexit vote. Is the cable back??
Below is the updated chart with the same setup:
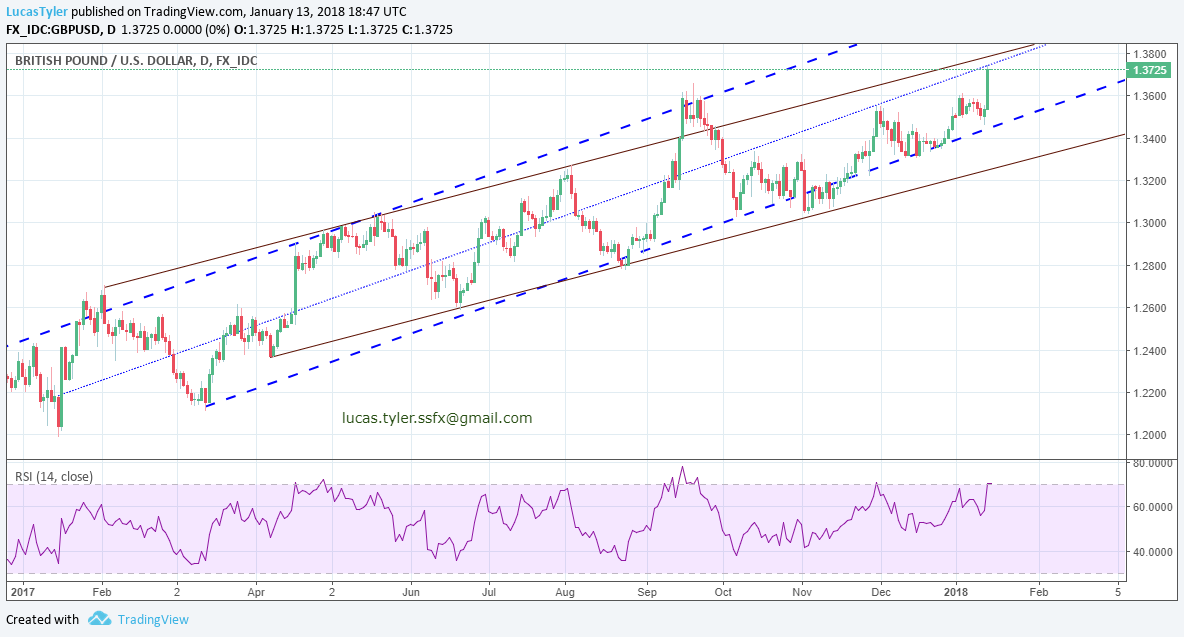
The price did not get in the zone between the brown and blue dotted uptrend lines, but achieve the rate target. So the resistances remain in play with a high probability of a local retracement. How deep is it going to be? That’s a question for a million. The war will show us the plan. Intraday momentum plus fundamental environment will give us a clue when to pull the trigger. Do you want to join our profitable community? Feel free to contact us.
There are also interesting situations with GBP/CAD, GBP/JPY and GBP/CHF crosses, so next week promises to be very lucrative.


No comments:
Post a Comment