Thursday, December 28, 2017

Why we're short on sterling-kiwi cross

Changes drive our lives. There are some turning points on any path you go. You can talk about complicated life conditions, unpredictable and uncomfortable circumstances, or even bad luck that guided you to this particular turn in your life. But the only thing that you can DO about it is to make a decision. A choice. What is the direction you go after this crossroad?

Changes drive the financial markets as well. We have a strong feeling, that we are facing a turning point during this period at the end of 2017 and beginning of 2018. It seems like we’re approaching to new huge trends formation in a lot of different assets. We cannot change these trends, but we can adopt to them.
One of the interesting assets for a mid-term trade is GBPNZD. Cross rates are usually lucrative in case if you choose the right side of the market. Please note, that we do not mean intraday trading or even one week perspective. We’re talking about 2-5 weeks range.

Fundamentally, the sterling stays in a consolidation range due to the same Brexit issue uncertainty, as British politicians like to repeat last 18 months. There are some negotiations between UK and EU scheduled for January, but traditionally all of the outcomes of such meetings turn negative for the pound. The economy is doing pretty well, but BoE seems to be interested to keep the pound at low levels. All of the latest comments from MPC officials ‘scream’ about this interest.

On the other part of the equation, there is a growing economy in New Zealand. Local consumption, employment and production has a strong and sustainable momentum. Plus the the external market conditions are favourable for this export oriented economy. Chinese production picks up, demanding more commodities, creating a bullish trend in prices. And the main change that happened in New Zealand recently, was the election of new Reserve Bank of New Zealand Governor. I quote here an official press-release posted on RBNZ: “Adrian Orr has been appointed as Reserve Bank Governor effective from 27 March 2018”.

The market players reacted with buys of the kiwi across the board on that news, because Adrian Orr is well known as a hawk. New cycle of tightening policy is expected from this new official, which means good perspective for NZD.

SS FX Management analyst team has a strong suggestion, that GBPNZD should continue bearish run based on this fundamental divergence. Technical background is illustrated below.


________________________________________________________
If you are interested to get more analysis, trade signals, consulting or coaching please contact us:
lucas.tyler.ssfx@gmail.com
SS Forex Management Facebook Group

Wednesday, December 27, 2017

New Rand era to come?

South African Rand shows one of the best performance among emerging market currencies. USDZAR is testing lowest levels since March 2017 and weekly rates are below long term Simple Moving Average with period 233 weeks, first time in 5 ½ years. Will the pair continue posting fresh lows?

First of all, fundamentals, as usual. The Rand will continue appreciating as long as political expectations will keep the recent positive sentiment. The South African economy has been undervalued by international investors for years.

From technical point of view, the prices reached long term support on daily timeframe. It would be healthy to see a bounce after a first test of the lows from March 2017 (daily lows at 12.3126, and daily close at 12.4344). But the question is about the depth of such bounce. Conservative analysis tells me to pay attention to the blue median line on the daily chart below as an entry point for next shorts. As you may see, it worked well several times as a resistance line during 2017 first half downtrend and as a support line during the uptrend. Moreover, the latest gap of daily prices jumps exactly through this median line as resistance breakthrough.


However, would the market give us such a gift by returning to this line? When could it happen? We should take a closer look at H4 timeframe in order to answer these questions. 


Here are two simple moving averages with periods 34 and 55 (Fibo numbers). I like the green median line, as it goes exactly at the middle of the range between those two SMAs. RSI could come back to 50% level before the bearish continuation. So, approximate range of 12.6300/6500 should be deep enough to consider new short positions.

2017 last trading week ahead. EURJPY, AUDJPY and CADJPY outlook.


As long as major currency pairs are stuck in a tight range due to the low volume of trades on holidays, there are some interesting actions on Japanese yen cross-rates. Asian investors are always looking for attractive markets, and Bank of Japan continues to support flows of speculative and credit capital from Japan by injecting enormous liquidity to the market. Borrowing fund remain cheap with interest rates at historical low levels. Traders and investors have not much of the choice when it comes to stable markets to direct capital flows. Except the leader worldwide economy, there is a Eurozone with sustainable economy growth and also Australia and Canada. The fundamental background of appreciation of the commodity currencies are described in the previous post.

Technically, USDJPY is in a very tight range recently, close to 2017 year high levels. My experience observing this pair tells me about possible test of current intraday support before setting for bullish uptrend and before reaching new highs. Looking at the H4 chart below, I would highlight the following supports:Ichimoku cloud base and local trendline at 112.883; local lows at 112.472. I would also say about the lowest level of such a possible whipsaw at 112.010, which could be used as a level to hide the stop-loss.


This chart and technical suggestions are not about my possible longs of USDJPY. My point is that we could see a retracement in EURJPY, AUDJPY and CADJPY, which should be considered as buying opportunity. Of course, we need to watch closely the momentum of pairs like EURUSD, AUDUSD and USDCAD before going long on yen crosses. Technicals are below.


I do not have a habit to buy on the top of the market. So I prefer to wait for a pull back and join the party with better ticket prices. However, the markets could not give us such a gift and possible retracement levels have to be updated in this case.


Tuesday, December 26, 2017

2017 last trading week ahead. USDCAD and AUDUSD.

Most of the financial markets were expecting the Western part of the Globe to finish celebrating Christmas. Not much of changes on the horizon during the Boxing Day in U.S. trading session on Tuesday. The greenback was weak generally, without big moves though, due to the thin market and low volume of trades. Commodities like Gold, Silver, Iron Ore, Copper pick up the momentum and surge. Oil, both Brent and Crude WTI, jumped 2%. All these factors support commodity currencies, which have posted fresh 2 months highs against U.S. dollar. But the biggest question is about further continuation of such an appreciation.

Fundamental predictions are mostly in favor to continue. January is traditionally a slower month in U.S. The market played out the positive expectations of the tax reform and most of the attention will be focused to new Fed Chairman and his words and actions. USD will have a strong relation to US Treasuries. So I expect further weakness in USD in January.

The prices of commodities grow on demand acceleration. Worldwide economy is recovering and some economist predict 2018 to be one of the fastest years in that scope. All of the latest data from China, one of the leaders in metals imports, is on a strong pace. However, North Korean conflict could become one of the challenges not only for the region, but also for the whole world. But so far it’s silent.

Technical picture is telling me that we’re approaching important long term support levels of USDCAD and resistance levels of AUDUSD. You may find some charts below. 


Assuming all, I would recommend those traders who still hold shorts of USDCAD and longs of AUDUSD to take profit and shift to wait-and-see mode. It’s very important to observe how commodity currencies will behave in these ranges. Most probably, we’ll see a pullback, which has to be considered as entering opportunity.

One more interesting currency to watch is japanese yen in relation with commodity currencies. But this will be a separate topic to discuss, so stay tuned for updates.


Thursday, December 21, 2017

Shine, Loonie, shine!

We all have habits. We usually wake every up day and do the same stuff. Some of the habits are good and useful, some of them are not. Anyway, you can easily build a portrait of a person, by knowing his/her habits. I have a habit of planning my trading week and day. First thing that I usually do before planning is looking at the economic calendar. It’s showing me ideas about the trading plan.

I see two important blocks of economic data scheduled for today: GDP and Philly Fed from U.S. and Employment, Retail Sales and Inflation figures from Canada. Now try to guess, what is the main currency pair I’m going to trade on today? - Exactly, it’s USDCAD. First part of the equation is weak. I do not expect any significant support from the third reading of GDP report from U.S., even if they revise it up to 3.4% in Q3. It would not have any impact on Fed’s point of view, while a potential down revision will add weakness to the greenback. Philly Fed Manufacturing report has low expectations and it does not have a big impact traditionally.


But look, what was happening on Canadian data in 2017? Surprisingly fast economy expansion, stronger-than-expected growth in consumption and production, inflation pressures and low unemployment forced Bank of Canada to tighten more rapidly, than the markets expected. Two fresh examples are illustrated on the USDCAD chart below: strong reports on December, 1st and BoC Gov Poloz speech on December, 14th. One more supportive factor for the loonie is the uptrend in crude oil prices. Once the WTI Crude Oil price will break the psychological level of $60 per barrel, it will make additional profits for the Canadian economy, dependent on oil exports.


Technical picture on the H4 chart below is mixed. An obvious horizontal resistance line is exactly at 1.2900 level. Yes, there are some attempts to break it, but all of them are failed, leaving just shadows on H4 candles. However, RSI oscillator is in bearish zone, below 50% level. Two nearest supports are SMA89 and SMA144 at 1.2816 and 1.2796 respectively. In case if the prices will break them clearly, we could see a further slide of USDCAD down to 1.2700/50 range. I would not be surprised if we’d see a test of 1.2650 support level as soon as this week, the same level has been tested on December, 1st after strong economic reports.
I plan to short USDCAD 5 minutes before the reports scheduled to release at 01:30 PM GMT. Of course, all of these technical suggestions will not work in case of weaker-than-expected reports today. And I will reverse immediately.

Two more assets to watch in the scope of difersification are GBPCAD and CADJPY. I mean a possible situation, when USD will surge suddenly, and will lift the USDCAD pair. In this case pound and yen will be weakest opponents for the greenback, I suppose. And the direction of the cross-rates will depend on the difference in volatility and speed of movement. Technicals are shown below.


Wednesday, December 20, 2017

The Old Man And The Sea


An individual forex trader survives in tough environment, trying to stand against huge market. I recall 'The old man and the sea' by Ernest Hemingway. Remember an old man in a small boat in the middle of the ocean trying to catch a fish and feed himself and his family. He catches a fish, but it appears so big and he faces troubles to get it out and bring it to the shore. At the end of the story he hardly survives, coming back to the home with a broken boat, woundes and almost nothing as a catch.

Sounds familiar, isn't it?

Just imagine, you fight against a market with daily trading volume of around $4.7 trillion. Even if you have an account balance $100K and your leverage is 100:1, you are still very small piece of food to be swallowed by deep ocean sharks. They would not even notice the fact that you appeared in their stomach.

I remember myself when I just started. I was like a blind kitty in a dark room. No clue about the reasons why the prices moved in this or that direction. No information about the volume of trades in this particular hour or day. So many market traps around...

I started to gather information by small pieces, bit by bit. At some point I found an analysis agency for professional traders. This company brought a ray of light to the dark room. They provide deep analysis. They have several technical indicators, modified and developed by their own team. They used to work with individual traders in the past, but now they deal only with institutional investors and big trusted brokers. One of the brokers, providing free Trading Central services to their clients, is GKFX, based in UK and regulated heavily by Financial Conduct Authority.


What I realize, looking at the past, is that you're alive until you discover something new and keep learning. No matter, how much expereince do you have, or how much money you made in the past. Past performance does not guarantee future results. Let the profit be with us! 


____________________________________________________________
If you are interested to get more analysis, trade signals, consulting or coaching please contact author:

How deep will the Bitcoin retrace?

We observe a classic retracement of Bitcoin prices, after the market saturation on breathtaking run to $20K. Some of long term investors pulled the trigger to exit and fix an awesome profit before the Christmas, some traders listened to loud woes about possible bubble and the scam. There were rumors that one of the Bitcoin founders has sold all of his assets. A South Korean officials stepped in, warning about too fast appreciation of the cryptocurrency and lack of the security from hacker attacks. Anyway, we see a downside pressure and ongoing retracement. The question is; ‘What’s next? How deep will the Bitcoin retrace before renewing the bullish run?’
We need to understand the motivation of people, who have enough power and money to manipulate the mood of the crowd. What is their best interest? One of possible answers could be a simple wish to get in to the market, buying Bitcoin at lower price. They made a huge step in the sense of regulation of this new type of asset, by launching Bitcoin futures on CBOE and CME. The second step is to kick out of the market as many retail traders and investors as possible. So I could suggest a further appreciation of Bitcoin, but the question is when should I join the party?


Technical analysis tells me to be cautious of pulling the trigger too early. I would expect better prices to get in, with further southwards pressure. Two different ways to show the BTCUSD daily chart are represented below. The first one uses a combination of slow MACD and fast RSI technical indicators. This combination usually works well with most of the assets. You can see an obvious bearish divergence on the first chart below. The prices were posting higher highs, while MACD and RSI were showing lower highs. Despite the fact, that MACD histogram already turned negative (which is usually a signal that the divergence worked out), I think that there is more room for retracement. One of the signs is the cross of blue and red MACD lines. The second one is RSI at 64% currently. Usually it moves down to test 50% level before reversing. I would consider the retracement deep enough when BTCUSD would test the blue dotted median line. But again, it’s a conservative point of view, and we could not see such low prices.


The second daily chart below uses simple Fibo retracement levels indicator. The latest bullish run started in November is the base for calculation of the retracements. Please note, that daily close prices took in count here, but not highs or lows. We can see here that 23.6% Fibo supports close prices, while there are shadows (lows) breaking it temporary. Very crucial for the technical analysis will be this particular day, because we already see s long shadow on today’s candle. The question now is about the body of this candle, will it be big enough to confirm further slide, or will it be thin (or even bullish?) to confirm reversal. Conservative position would be to go long not earlier than 15500/800 range on possible test of blue support line.


One more chart below has H4 timeframe. We see here an obvious break through the latest support line, which is bearish signal. On the other had, we see a support by the prices bouncing from local lows (blue arrow). MACD is in bearish mode. RSI is far below 50% level with more room to go down before oversold levels. I would expect a comeback of the RSI to 50% level and further slide after that. Such a scenario would confirm my suggestion about deeper correction, while an opposite outcome would indicate a false bearish break.


4 reasons to go long on EURGBP

The tax reform in U.S. is almost gone out of the focus. Traders and investors in financial markets will shift attention to the next period and future events, right after (or even before) the Christmas break. January is traditionally slower than November and December in the sense of economic growth and expansion. New Fed Chairman, Jerome Powell, is about to step in in March, but market players will pay a lot of attention on his possible speeches, trying to understand what to expect from him in the upcoming months and years. We expect a slide in USD comparing to major currencies at least. Euro could be one of the alternatives to the greenback in the sense of shifting speculative flows. Fundamentally, Eurozone economy continues to show strong performance.

British economy is also doing well, despite the ongoing talks about Brexit outcome. And I think that the pound is heavily undervalued. But BoE MPC officials continue to push the currency down, preventing any pick up in sterling momentum. They have their own reasons to do so, I described my suggestions in one of the previous posts. And please don’t tell me that central banks do not manipulate their currencies, and the exchange rate is influenced by open markets, demand and supply. What they do is create emotions and rumors in order to direct the trend. MPC Gov Carney holds a press-conference today 1:15 PM GMT and I think he will try to push GBP lower.


My point is that even if the USD will continue gaining strength, we could see GBP going south faster than EUR. And if the greenback will lose the ground in January, we could see appreciation of EUR faster than of GBP. We had the same story in September, by the way. Several analyst were predicting EURGBP to go to the parity till the end of 2017. It did not happen so far, but EURGBP is definitely in uptrend. The retracement, which we’ve seen recently, seems to be deep and healthy enough. So, I expect a continuation of EURGBP uptrend with new highs to be posted in the nearest 2-6 weeks.

First chart below has the weekly timeframe. Main message from technicals here is the bullish MACD divergence, confirmed by RSI divergence. The prices are supported at 0.8774 level (lowest close price since July 2017). Long term support of SMA89 indicates bullish continuation. So we expect EURGBP to come back to the blue rising channel. First target is the range of 0.9000 / 0.9020. Breaking this resistance will open road to local highs around 0.9250.


Daily chart below is more neutral rather than bullish. But there is a little sign for bulls: Yesterday daily close is above middle BB red line. This fact increases the chances for the pair to test upper range of BB at 0.8930. By the way, you may also check daily oscillator RSI14, which has crossed the level of 50% yesterday and also confirms bullish continuation.


EURGBP is traditionally a slow mover. Intraday traders do not like it too much due to low volatility. But this position could be profitable for mid-term traders, who can afford themselves to create a portfolio of assets and use buy-and-hold strategy.


Let the profit be with us!

____________________________________________________________

If you are interested to get more analysis, trade signals, consulting or coaching please contact author:
email: lucas.tyler.ssfx@gmail.com
WhatsApp: +380931328731
SS Forex Management Facebook Group

Tuesday, December 19, 2017

Midweek FOREX update

The markets are stuck in a tight range, with most of the assets trying to find a direction. Especially when it comes to the USD assets. And there are two main reasons for that: Taxt Caut reform legislation in US and upcoming Christmas Holidays. The economic calendar is not giving additional volatility as well, due to absence of major events, as it was past week. Bank of Japan meeting and press-conference, RBA meeting minutes, New Zealand, British and U.S. GDP releases and Canadian employment reports. Not much for a whole trading week, huh? Friday is going to be a short day in London session with early close at 12:30 PM, so we do not expect the markets to be very volatile on that day.

Main headline events are scheduled for Tuesday - Wednesday and they come from US politicians. The biggest question for the markets is whether Republicans would be able to pass both House and Senate votes in order to finalize the tax cut deal and put the project on President's table in order to sign it. US stocks post new historical highs on the positive expectations, while the greenback does not show such a strength and confidence. We're also quite sceptic about the perspective of the US Dollar in a long-term scope. The tax reform in US creates additional budget deficit, and the only source to cover this new hole, would be to enlarge the volume of external debt, which is already huge. Add here a negative trade balance of the United States, and you will get a picture which creates concerns for the foreing investors, who could be very sensitive to such imbalances. A USD sell-off could take place on any minor disappointment. And failure of the tax reform or any changes in Fed's hawkish rhetoric next year could be such disappointments.

We're looking to reverse on precision metals like gold and silver in our mid-term perspective (4-8 weeks). You can find below a long term squeezed daily chart of gold Futures. In case if this intermediate local low (blue arrow) holds, we could see a comeback to 1280.00 / 1300.00 range of prices. Nearest resistace, 200-days Simple Moving Average is very close: 1271.09, so there are big chances that market players will try to test it this week. MACD lines have executed a bullish cross and RSI14 is back from oversold level. Any closing dayli price with RSI14 above 50% level would indicate further bearsih continuation. 


Thursday, December 14, 2017

Will BoE MPC keep playing a dovish role?

Try to ask yourself one more question before asnwering the first one. What was the purpose of Brexit? It's almost 18 months since BoE MPC officials keep repeating the same mantra: Brexit uncertainty. An obvious sequence of historical decision to leave the Eurozone is a change in orientation of the economy from imports to exports emphasis. Ex-partners in EU become competitors to fight with for both UK and EU huge consumption markets. Keeping the pound at low levels helps also to attract wealthy americans to spend their dollars in UK. 

These are simple explanations why we still see BoE interest rates at historically low levels despite the strong performance of the british economy. Mr. Carney predicted that inflation in UK peaked recently, and MPC expects a slowdown in growth of prices. Recnt data this week is mixed with CPI, wages growth and Retail Sales higher than expected, but weaker employment figures. We still think that sterling is undervalued, but it seems like someone big fights against further pound appreciation.

We would consider shorts of GBPAUD right after rate decision on Thursday. Technical pictures are below. Key bearish technical points: weekly Bollinger Bands have bearish reversal signal (blue arrow); daily MACD lines crossed and RSI14 has bearish divergence with prices lower SMA20; H4 Ichimoku indicator is bearish.   


3 reasons why we’re short on EURUSD


US Federal Reserve raised interest rates as expected. Main focus was on the statement and Yellen press-conference. USD bulls hoped for an announcement of 4 rate hikes next year with more hawkish sentiment. It did not happen. One of the reasons could be a confidence in successful tax cut deal, so there was no need in further support of the reform from FOMC. Plus it seems like Yellen decided to leave a room for maneuver to the next Fed Chairman, Jerome Powell. We’ve seen a slide of the greenback as the result of such disappointment, which has been limited though. US T-Note yields lowered yesterday, but the stock indices showed record highs. Usually rate hikes from the Fed are negative for stocks, but support came from politicians, announcing tax cut deal and good chances to pass votes on Wednesday next week.


We went short on EURUSD despite the upside sharp run on Fed yesterday, and here is why. We do not expect Euro Central Bank Chairman, Mario Draghi, to change his boring and dovish rhetoric during his press-conference on Thursday. It’s in his interest to prevent euro from too fast appreciation, taking in count how many export oriented countries are behind him. Inflation remains low, and it would be the main justification for ECB to keep the interest rates at historically low levels and to continue liquidity injections to the banking system. Cheap borrowing funds are positive for business, creating a comfortable environment for further growth of production, investment, consumption and employment. Plus do not forget about external competition.


Second reason is the continuation of the same tax cut reform expectations in US. The rumors circulate for quite a long time and seems like politicians are very close to finalize the deal and make it real. This gives a support to US companies, lifting the expectations of growth in corporate earnings. In a world-wide perspective, US corporate sector becomes more attractive for foreign investors, which could increase the sustainable demand in US dollar.

The third reason is technical. You can find below EURUSD H4 chart setup, updated after we showed it in last post on Sunday. Bearish factors are: the price failed to breakthrough the SMA89 (1.1834 green line), remaining below red middle line of the downscending channel from highs in September. Blue lower dotted line is a clone of support line from May 2017. Broken support works as the resistance. RSI14 shows a bounce-by-trend (blue arrow), which usually is a bearish signal from the oscillator. Targets for this week are: 1.1725 and 1.1680.


Let the profit be with us!

____________________________________________________________


If you are interested to get more analysis, trade signals, consulting or coaching please contact author:


email: lucas.tyler.ssfx@gmail.com
WhatsApp: +380931328731

Saturday, December 9, 2017

Three haevyweight elephants on the stage next week.


The past trading week has been definitely in risk-on mode. The greenback strengthened against all major currencies on positive news about tax cut deal and strong economic reports. NFP payrolls report showed 228K jobs added in November, unemployment rate remained at 4.1% low level and wage growth slightly missed the expectations: +0.2% vs +0.3% expected. However, the currency market players did not have any major reaction on the report, USD index had a temporary retracement right after the report, bouncing back up at daily high levels. US stock indices continued the bullish run on Friday, S&P and DOW had historical high close, while NASDAQ recovered after tech sell-off earlier this week.


All eyes on Fed meeting and Chairwoman press-conference scheduled for Wednesday, December, 13. The big question for the greenback bulls will be not only the interest rate decision itself, which is already priced in by the markets, with Fed Interest rates Futures showing 98% chances. Investors and traders will watch the statement, economic projections and Yellen’s comments, to understand the next moves from the regulator. In case if Fed Chairwoman will confirm her hawkish sentiment about to continue increasing the level of interest rates, the greenback could continue it’s run. But if she will express concerns and cautiousness about low inflation and wages growth, we will see a sell-off or retracement.


There are two important inflation reports to be released before the meeting: November PPI on Tuesday and CPI on Wednesday. Both reports could have a big impact, changing the sentiment of the statement in last moment. One more supportive factor for the greenback could be a traditional year-end repatriation. Lot’s of US based corporations have businesses abroad and usually they are interested to bring the profit back home before year end, just to decrease taxes. Such a flow could create an additional demand for USD.


Technical picture for USDJPY remains bullish on the daily chart below. One important condition for bullish trend continuation has been occured on Friday by the price closing the day above Ichimoku span. Next condition to complete the reversal pattern is for the green line to cross the blu one and for both brown and blue lines to get out of the span. Next resistances for daily close prices is local highest daily CLOSE at 114.15 (NOV-01) and local highest daily HIGH at 114.73 (NOV-06). We expect the prices to test this resistance range BEFORE the FOMC meeting with a pullback to follow.


Two more major Central Banks hold their meetings, interest rate decisions and press-conferences on Thursday: Bank of England and European Central Bank. The british pound exchange rate suffered after the divorcement decision between two big economies in 2016. The British economy had uncertainty concerns and there are lots of European financial companies, withdrawing the capital and offices from UK. But british economy continues to show strong performance, despite the Brexit story. BoE has been forced to hike one time this year and MPC has the question about further tightening still open.

The latest news from politicians were mostly positive last week. Seems like there is a light at the end of the Brexit tunnel. At least they have deadlines now, and some ranges about possible compensation to the EU from UK. The sterling has been buoyant recently, but the momentum is unusual for the pound assets, traditionally sky rocketing on bullish sentiment. We can see many pullbacks of the pound after achieving some modest gains. Anyway, further movement will depend on Brexit talks, FOMC and BoE possible divergence in tightening policy and performance of economies on both sides of the Atlantic. Key UK reports to watch before the BoE: CPI, Average Earnings Index, Claimant Count Change and Retail Sales.


The GBPUSD rates are supported by median red line from May 2017. The latest blue pattern has also a continuation character, with current prices closer to the lower range. Fast oscillator RSI14 is also supported, staying above 50% bullish mark. Key ranges to monitor: 1.3319/55 as support and 1.3521/52 as resistance.


ECB is expected to continue the era of extremely cheap capital resources. They made decision to continue the quantitative easing, injecting billions of euros to the system. The recent economy performance is strong, but the inflation remains below the regulator’s long term target. I read this and realize how boring is Super Mario. We should think about to change TV channel during his press-conference on Thursday :)

EURUSD fundamentally mostly depends on the greenback in a recent pullback. We bet, ECB is really glad that they have managed to hold euro against the second test of 1.2000 level. They won the battle but they did not win the war! Like a blind man said: ‘We will see”.

Short term technical outlook for EURUSD leaves the risks for the downside. You can find below compressed H4 chart. The middle blue line used to be the support for upside trend since French election in May 2016. Parallel higher and lower clones of the line also work well as you may see. The prices have bounced down to the lower line, but both bullish and bearish scenario could take place before two Central Banks meetings in the upcoming week. There is a chance to go north upto resistance SMA89 at 1.1832 as the prices bounced right before the end of the Friday trading session and the week. But Further weakness is also possible due to the risk appetite and strength of the greenback. Key support range is settled between 1.1667 and 1.1554.


Let the profit be with us!  
____________________________________________________________
If you are interested to get more analysis, trade signals, consulting or coaching please contact author:
WhatsApp: +380931328731

Thursday, December 7, 2017

Will the greenback soar on NFP?


The world reserve currency has been strengthening this week. First positive news for the greenback came out from US Senate, passing the vote for the tax bill. Strong economy performance, tight labour market, growing GDP and positive expectations from the tax reform drive the demand for USD assets. The stocks are also in the uptrend despite high prices. Bulls dominate on the market, being influenced by fear of missing out. Plus there is no much alternative assets to invest in. Federal Reserve also adds hawkish sentiment. Expectations of the rate hike next week are close to 100%. There are lots of rumors and talks about how many times will Fed hike the interest rate hike next year. US dollar index already added almost one percent this week.


Big event for all of the market is scheduled for 08:30 AM NY time. US Non-Farm Payrolls report is traditionally an indicator of the economy’s health and measures the pace of growth. It is also monitored very closely by FOMC, having influence on interest rate decisions. It will be crucial to watch not only the NFP figure itself, but also two other components: unemployment rate and average hourly earnings. The last one is very important for inflation growth, which has been a concern for Fed officials recently.
The expectations are averaged at 200K jobs added in November. Any reading of the report around this number will support USD bulls. A disappointment figure below 150K could cause a sell-off, but the odds for such outcome are rather low. Labour market has been tight in US recently. One simple fact speaks for itself: Americans spent $7.5 Billion dollars for shopping in one single day on Black Friday. People had to make that money somewhere, right? So I expect a strong reading of the NFP report, beating the expectations and USD to go up as the result.


Technically speaking, the outlook is also positive. The daily chart below shows me signs of possible reversal. There is a bullish divergence on both MACD and RSI. The combination of these two indicators works well traditionally, especially for such high-volume traded assets. The blue line on the chart is Simple Moving Average with period of 200 days. I compressed the chart, so we can see the whole year range, starting from November 2016. As you can see, SMA200 worked well as a support on Trump’s election day volatile session (first blue arrow). We’ve seen a first test of the support in March 2017 and the bounce up after failing to break through (second blue arrow). We are definitely on bear mode since the USD index went below SMA200 in May (red arrow). But the rates do not go far from it usually, cause it counts rather big period of time of almost two thirds of the year. So I expect a come back to the SMA200 range for upcoming weeks.
       
You can find below H1 charts with the same settings. I’ve added one red trendline, which goes through the weekend gap, by the way. It’s resistance current and the target for bulls. But there is a potential bearish divergence on both MACD and RSI. The last indicator bounced a bit from the overbought territory, but still has rather high value. I would expect an intraday retracement before moving further north.


One of the most attractive currency pairs in such an environment is USDJPY. On the daily chart below I can see very important technical level for further direction. The price is trying to get out of the Ichimoku span. In case if the close price this Friday will be clearly above the cloud, it will open the road for new fresh highs this year.

Intraday trading strategy is the same as described above for the dollar index. Those traders who missed the signals can wait for a pullback and go long. Pivot points (06:30 AM) are: 136.26 and 112.92. Targets depend on your trading strategy and how greedy you are :-). And again, remember about main condition of the uptrend continuation, which is NFP report to be released strong today. Of course the rule ‘buy rumor, sell fact’ could take place today. So it’s always better to take your money and run.

Let the profit be with us!

____________________________________________________________
If you are interested to get more analysis, trade signals, consulting or coaching please contact author:

Sunday, December 3, 2017

What to expect from FX trading week ahead.

Global financial markets are heading to the last stage of the year 2017 before long Christmas break. Three upcoming weeks are crucial for trends of next year. Economic calendar is full of important events to watch if you want to determine the structure of your investments and trading opportunities.


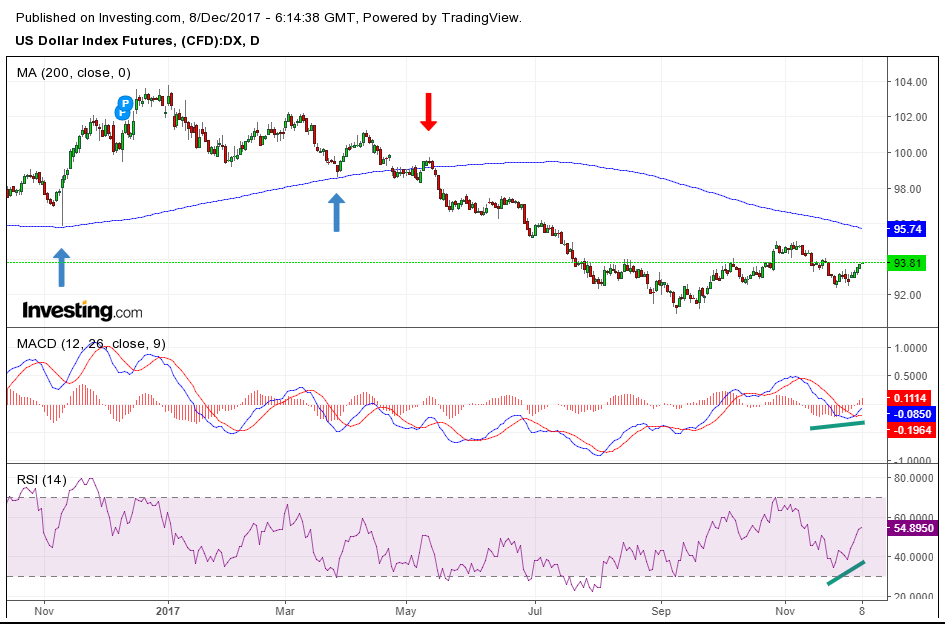
The markets are very sensitive to two headline topics in the leading worldwide economy: US tax reform and investigation against president. These topics are not listed in the economic calendar, so you should keep an eye on news. Any positive development of the tax bill vote story would support greenback bulls, while bears will be looking at any success in possible impeachment story.


Traders and investors will monitor closely the upcoming meetings, decisions and press-conferences of major central banks. Next week kicks-off with Reserve Bank of Australia and Bank of Canada interest rate decisions. Heavyweight players like ECB, FED and BOE are expected on the scene in December 13-14 period. Thus, FX speculators expect volatility to surge in two upcoming weeks, which might help to boost the Christmas holidays budget.


I will start the outlook with aussie. To be honest, I trade it rather rarely, but the next week calendar makes me feel some fresh profits. Retails Sales report, RBA meeting, GDP and Trade balance figures will determine the direction of AUDUSD and the rest of aussie cross-rates. Last comments from Australian officials tried to prepare the market participants for more hawkish tone in the nearest future. So, I would not be surprised if the RBA Statement will change the sentiment and allow the aussie to gain some strength.


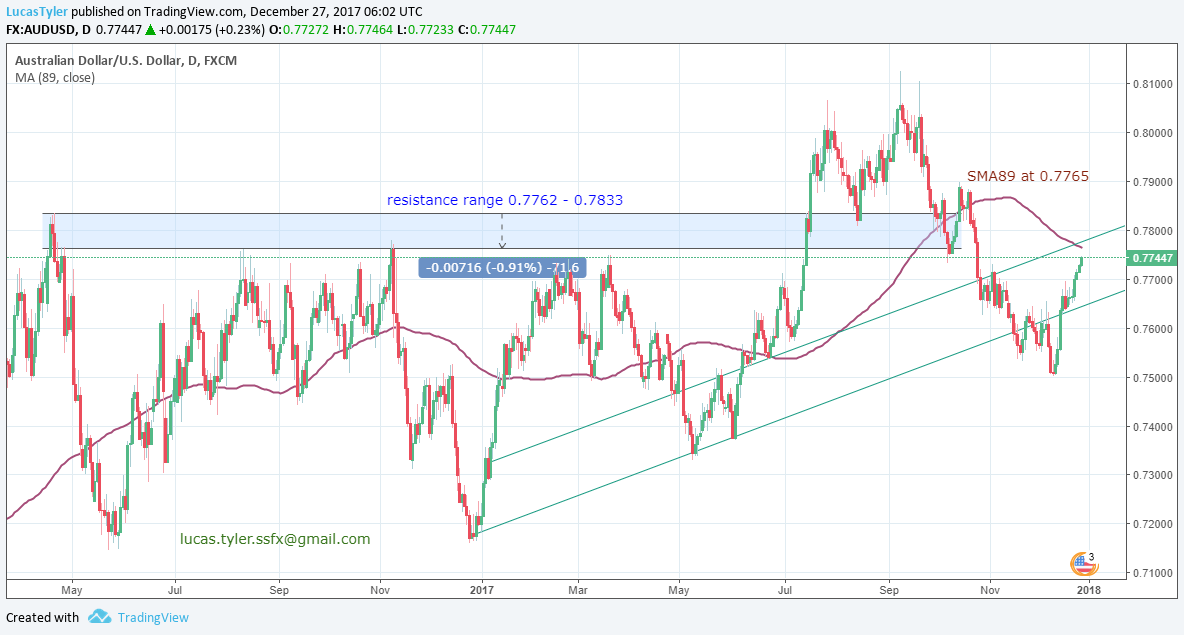
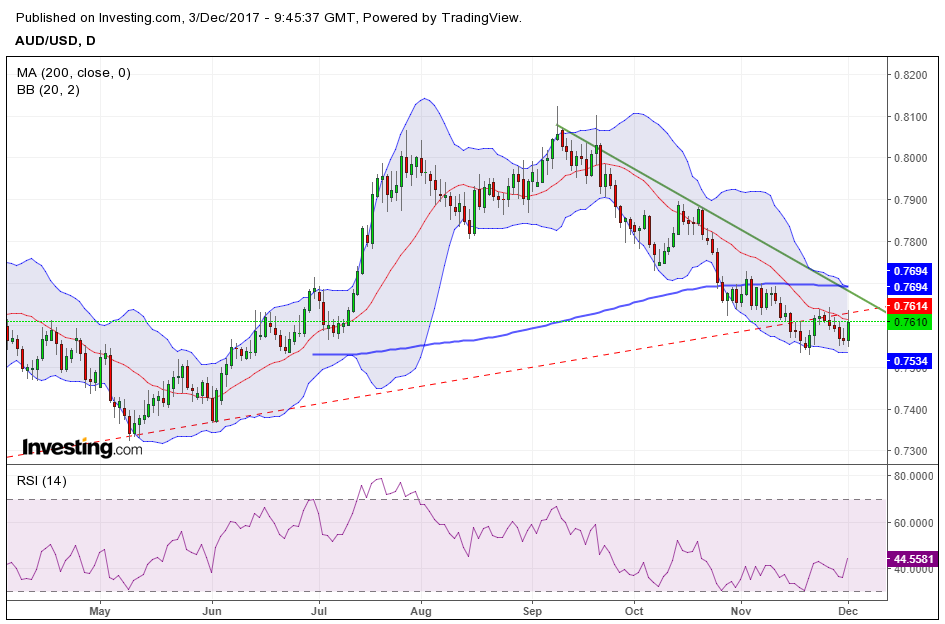
Technically, AUDUSD daily chart has several signs of possible upside correction if not reversal. First one is potential double bottom formation with higher lows. Second sign comes from fast oscillator: RSI14 heads up to 50% level to cross and turn bullish. Bollinger Bands support worked well last week.
The price action has to complete some conditions to confirm bullish reversal pattern:
  1. Daily close prices have to cross middle BB line (0.7614) together with mid-term median line (red dotted), which used to be long-term support.
  2. Break through green resistance line of the downtrend started in September.
  3. Move above 200-day Simple moving average and upper BB line. Both resistances are at 0.7694 mark currently.
These factors could open the road to 0.7750 target. I will be looking for intraday whipsaws to go long on AUDUSD, AUDJPY and go short on GBPAUD. However, if the RBA statement continued the recent dovish rhetoric, these technical suggestions would not work and the aussie would continue the downtrend. The show is scheduled for Tuesday 03:30 AM GMT, so get your helmets ready.


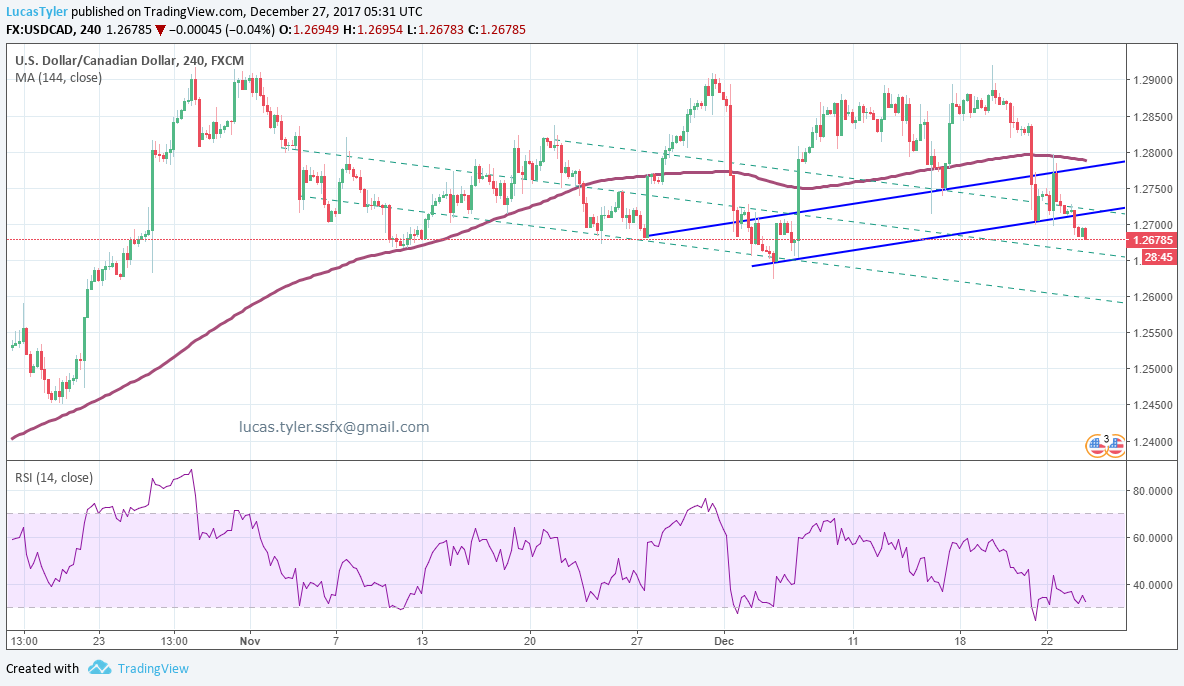
The next huge trading day is Wednesday. US ADP Non-Farm Employment Change report is not so important as official NFP due to a different methodology of calculating statistics, but traders will monitor it to adjust expectations of unemployment figures. Two crucial events for loonie will continue the flow of data. BOC rate decision and statement and US Crude Oil Inventories are due to release at 03:00 and 03:30 PM respectively. My prediction of USDCAD slide was accurate on Friday, finishing the past trading week with lucrative shorts on profit of 200 pips. But will USDCAD continue moving southwards?


Let me turn your attention to the past. RBA hiked the interest rates two times in last 5 months and both decisions were unexpected for market participants. So I would not be surprised if the regulator will decide to hike one more time this year, despite the cautiousness about possible bubble in real estate sector. The odds are low of course, but potential profit could compensate the risk. One more supportive factor for the loonie is the price of Crude Oil heading to important resistance level of $60 per barrel.


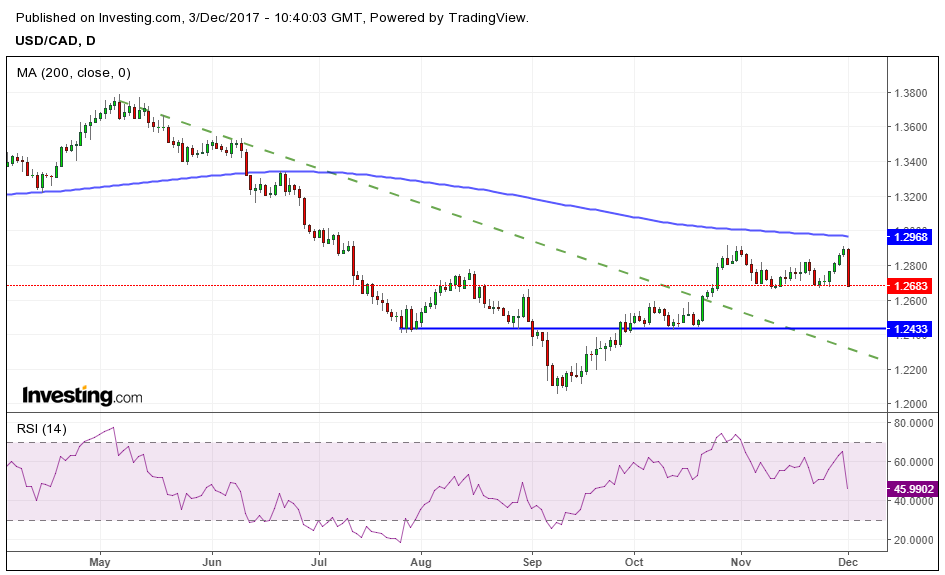
Technical picture tells me about downside continuation. First of all, the Friday huge bearish daily candlestick has only 2 pips of difference between low and close prices, adding chances for a weekend gap. Secondly, RSI14 is clearly below 50% mark, indicating bearish sentiment. It’s far from oversold levels yet, leaving the room for further weakness. Next support levels to monitor: 1.2621 (close price AUG-30), 1.2433 (June and October lows) and the green dotted median magnetic line (1.2250/2300).  


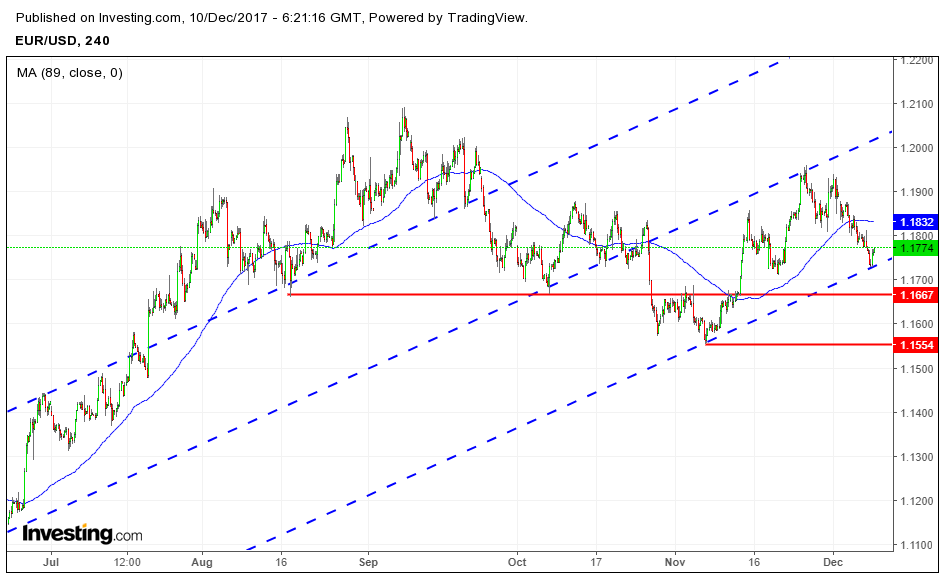
Let me get back to boring major currency pairs. All of the european reports scheduled for upcoming week do not have huge impact, except EU GDP on Thursday. So the trading direction will be determined by news flow from other side of the Atlantic, with the main event of US NFP on Friday. I do not expect EURUSD to get out of the recent range before Friday NY session, but who knows, how fast they will push it above 1.20 psychological level?..


Technical pattern of the H4 chart below is bullish. RSI14 is supported, posting higher lows with a lot of space to go up. The pair is buoyant on pullbacks to green support line. Simple moving average has the same trend angle.
I would recommend not to be greedy and take profits of potential EURUSD intraday longs around 1.1950 level. Long-term traders can hold long positions even through the NFP report in case if there would not be any huge unexpected figures like +300K jobs created in November. Trading NFP is always a separate story, which deserves special attention, so stay tuned for updates closer to the end of the week and feel free to give me a shout if you need any support.


Let the profit be with us!


____________________________________________________________
If you are interested to get more analysis, trade signals, consulting or coaching please contact author:
WhatsApp: +380931328731


Saturday, December 2, 2017

Bitcoin deep technical analysis

You can find a lot of sources for fundamental news about crypto and Bitcoin. This topic became very popular, so top news agencies picked it up quickly. I will just mention one important rumor, circulating on the market this week. They say that Bitcoin futures will be trading on NASDAQ and Chicago Mercantile Exchange in the first half of 2018. What does it mean? It means that once the asset becomes regulated, institutional investors will have permission to trade it. And this will bring huge volume to the market. Bitcoin capitalization reached $162 billion, more than giants like IBM, McDonalds and General Electric. It was key driver for bulls to push the prices higher on Friday session.


But I will talk about technical analysis here. Despite the fact that Bitcoin is a new asset class, something that never been in use before, the trading rules remain the same. There will be overbought and oversold ranges, resistances and supports, pullbacks and retracements. Technical analysis is secondary, the most influence comes from fundamentals. But still it’s very important tool to use in every trading strategy. You should understand one more important thing. There are lots of different sources of the exact price of Bitcoin and quote of BTCUSD asset. It depends on what exchange you use for conversion of cash to crypto and vice versa. Localbitcoins is one of the most popular echanges supporting instant buy and sell Bitcoins for cash in 258 countries.


I tried to use different technical indicators for BTCUSD. They work very bad mostly in such price action as we see in 2017. +992% wow. So we need to keep the technical analysis as simple as possible. I have shown one simple and effective trendline in my previous post. I also checked Fibonacci retracement levels and got some results. I use daily time frame for all of the charts below. You can see four stages of growth and retracements on the chart above.

Here are some figures about these ranges:


stage
price from
price to
change
change, %
1A
891.00
3000.00
+2109.00
+236.7%
1B
3000.00
1835.80
-1164.20
-38.8%
2A
1835.80
4827.40
+2991.60
+162.95%
2B
4827.40
2981.00
-1846.40
-38.3%
3A
2981.00
7895.00
+4914.00
+164.8%
3B
7895.00
5786.10
-2108.90
-28.7%
4A
5786.10
11187.00
+5400.90
+93.3%

You can find enlarged charts of the ranges below together with Fibonacci retracement levels. Please note that I use the Fibo indicator for CLOSE daily prices, not HIGHS or LOWS


1A-1B. Both retracements (blue arrows) closing prices are above 50% level.


2A-2B. Three Fibo levels worked well to renew longs or take profit of shorts. 38.2% (red arrow), 23.6% (blue arrow) and 61.8% (green arrow).


3A-3B. The retracement closing price fits exactly in 38.2% Fibo level (green arrow).


4A. This stage is not accomplished yet. As you may see from the spreadsheet below, we could expect further upside movement for 4A stage as it’s +90% roughly so far. But at the same time, Fibo levels worked well during both volatile sessions this week: Thursday and Friday. Low prices fit in 38.2% level and closing prices are above 23.6% mark. Red arrow on the chart below.


Technical conclusion. We can expect further upside run up to $15082.80 per one Bitcoin (+161.8% from NOV-13 open price). And we’ll be looking for retracement back to a level around $11523.25 (38.2% Fibo).


Let the profit be with us!
____________________________________________________________
If you are interested to get analysis of other cryptocurrencies, please contact author:
WhatsApp: +380931328731


Don't try. Do. Action is something that brings you to the next level. You should keep in mind that no thought, no word can enhance your ...