Thursday, November 5, 2020

Don't try. Do.

Action is something that brings you to the next level. You should keep in mind that no thought, no word can enhance your life or improve any aspect of it. 


Just action. 


Of course, any action leads to a consequence and, possibly, reaction. Besides, responsibility appears afterward. And this is something you will live with as there's no chance to change the past. 


If you want to enhance your lifestyle, you should be ready for that. If you were looking for a lifetime opportunity, you should have been prepared to accept the gift. Pull the trigger when the target appears in your rear sight!


Deposit today with one of my partner brokers and get two weeks free consulting and market analysis on demand. Join my WhatsApp group for more details.

EURUSD reversed.


The single European currency reflects the overall FX market the most in terms of demand/supply ratio for the world’s reserve currency -- the US dollar -- as the EURUSD currency pair has more than 60% share of the greenback’s trading volume. Besides, when it comes to the fundamental and macroeconomic side of things, Euro will be the only alternative to the US dollar until the Chinese government will release the renminbi (Chinese Yuan) fluctuating freely. Since the long-term strategy of the second world’s economy -- China -- looks to be solid, and the superpower country is not willing to change its path to a hybrid economy, USDCNH is poised to fluctuate on a small portion of the overall volume in offshore exchanges. Therefore, if you were looking for a strong currency, then you would not have much choice rather than Euro.  

The European Central Bank is in the same situation with the COVID-19 pandemic as other regulators in the world. To keep supporting the economy, to minimize the negative impact of lockdowns, the ECB is forced to keep interest rates at zero levels with enormous amounts of additional stimulus. But if we put ourselves in the Fed’s shoes, we’d got nothing to do as well. FOMC has to pump the same enormous additional liquidity into the financial system. In simple words, keep printing more and more dollars.

Now since the elections’ impact is almost off the table (traders and investors always anticipate fundamental events and risks involved but not act afterward), the level of volatility is getting lower, and, what’s even more important, the risk appetite is growing. Therefore, financial institutions start including in prices another bale of fresh bucks printed by the Fed. Would you sit on the cash when the inflation eats a constant portion of it? Or would you find a reasonable and secure alternative to the greenback? Euro looks to be one of the best choices. 

The technical outlook gives me an additional reason for a cautiously optimistic forecast about the EURUSD exchange rate. When I open an intraday chart with a four-hourly time frame, the first thing I see is the reversal head-and-shoulders pattern. The neckline of the H&S figure must have the right incline (i.e. the right shoulder is lower than the left one). Next, the post-election day brought high volatility to the FX market and EURUSD was not an exception. However, both upper and lower tails were quite high meaning that traders used to enter into the market from both sides when the pair was offering attractive entries in terms of the amplitude. As a result, the last red candlestick’s close formed the right shoulder at 1.1660. If you were able to see that close rate in the middle of the night on Wednesday, you could have had a brilliant entry point. 

Since then, EURUSD is rallying for more than 150 points, and my analysis shows that it gained another 100 pips at least. The rate has breached the 89bars SMA and entered into the previous ascending channel. For the technical analysis, that means that a double resistance has been eliminated, and the bulls won’t stop until the next one. I will keep holding longs for EURUSD targeting 1.1850 and 1.1875 in extension. 

Sterling to soar to 1.35 versus the greenback?


The British Pound is currently one of the most attractive currencies to buy, especially versus the US dollar and the Japanese yen. Several macroeconomic concerns used to hold Sterling from a rapid appreciation, however, they all seem to pass away shortly. First, the US presidential election is coming to a logical end, and the trick for GBP is that it can gain whoever will become the US President. 

Donald Trump has always been an ardent supporter of the Brexit process as the British economy could have benefitted from integration to the US orbit while getting out of Brussel’s influence. The faster the Brexit sage will come to an end, the faster the British economy will start performing in the same way it did previously. High level of income and spending among the British population, infrastructure investments, and the role of London as one of the most important financial capitals of the world should direct the funds' inflow to the UK’s financial sector more affluent.

Joe Biden is also a good choice for Britons just because of his program to improve the international trade environment, get closer to China and EU, improve the global investment sentiment, and increase the risk appetite. Besides, the additional fiscal and monetary stimulus would create lucrative opportunities for carry-flow speculators interested in bargaining on yield difference. The outflow of US dollars should create additional demand for other major currencies, while the British Pound looks more attractive compared to other slow-moving majors.

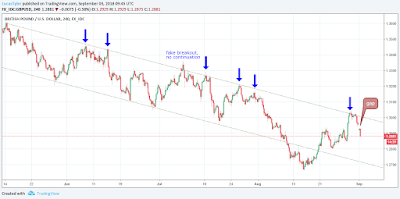
When it comes to the technical analysis, the squeezed H4 chart above points to a huge ascending triangle with a horizontal baseline at 1.3500 dollars per pound. After the freefall in March 2020, caused by the coronavirus panic sell-off, the GBP/USD currency pair is in a continuous uptrend. The graphical analysis shows an obvious support trendline with three solid touchpoints (failed tests) as buy opportunities. The last one has been posted just recently, and Sterling’s bounce towards mid 1.28 figure was attractive to enter longs with a swing trading strategy. Those traders who used the opportunity of the market’s concern related to political and economical issues can enjoy quite a crispy haul now. Let’s have a look at whether it’s worth taking profits at this level, or should GBPUSD gain another couple of hundred points.

Bullish signs are as follows: the latest H4 candlestick has a close rate above the exponential moving average with a period of 144 bars; the Relative Strength Index charted a bounce-by-trend pattern at around the middle zone; the buying pressure is constant above the psychological figure of 1.3000 dollars per pound. The lack of bullish momentum can be explained by two factors. First, market players are expecting a final verdict for the presidential election and want to see the equity market reaction before pulling the trigger. Big money never rushes. Second, the US Federal Reserve and the Bank of England are going to have their meetings this week to announce the volume of further supportive measures, i.e. the amount of additional liquidity pumped into the financial sector. 

This could cause a rapid rally of high-yield assets, and GBPUSD would not be an exclusion. Technically speaking, Sterling has to break through the 78.6% Fibonacci Retracement level at 1.3050. That will open the road towards the median resistance line slightly above 1.3200, and the triangle’s baseline at 1.3500 in extension. Patient traders with a deep buffer in the account balance can freely use a small portion of free margin to go long on Sterling. Remember though that GBPUSD is that kind of currency pair that can add surprising false whipsaws into the price action, so standing temporary under the water of 100-150 pips should not be a huge surprise but a chance to add more volume to longs. 

Wednesday, November 4, 2020

How the U.S. elections uncertainty will impact the Forex market (part I)


Uncertainty leads to high volatility. This centuries-old rule works perfectly in modern markets despite all of the technological breakthroughs, artificial intelligence, etc. The first day after the US elections impacted gaps on several major assets in the Forex market. The directionless and nervous price action was seen in the US dollar index measuring the greenback’s strength versus the volume-weighted basket of six major currencies as well. At the time of writing (10:40 AM GMT), EUR/USD was losing -0.2% of its exchange rate, GBP/USD was easing by -0.80%, while the rest of the majors followed the same direction with an approximately similar trading range. 

The capital flow to the greenback happens when traders and investors are not ready to impose too much risk in their portfolios, so they rush back to safety. Besides, the US 10-year Treasuries yield was plunging -13%, confirming the higher-than-average demand for safe-haven bonds. Therefore, the greenback was strong across the board on Wednesday.

When looking at the 4-hourly chart setup above, the first thing which catches the eye is the bearish gap on Wednesday open. However, the greenback bulls reacted with immediate demand, pushing DXY much higher than the daily low. On top of that, the US dollar index kept gaining during the European trading session. 

What's interesting from a technical point of view, is that on the one hand, the H4 rate is well above both Ichimoku resistance curves - baseline and conversion line, while the leading span is confidently bullish. The lower band of the gap was limited by the bottom of the cloud, offering a brilliant enter opportunity for intraday traders. Bounce-by-trend patterns and extremely oversold conditions on both oscillators prompted reversal signals as well. The overall outlook tells me that the descending channel that held DXY in September - October this year, is already in the past. The longer-term ascending channel seems to come back in play with the current rate approaching the upper band of it. A possible breakout could impose the acceleration of the uptrend. 

In the short-term perspective, fast and sensitive oscillators such as Williams %R are overbought. That could influence a short-term retracement or a lack of further bullish momentum to drive the greenback higher. Slower oscillators like Stochastic RSI (which smoothes too much noise by the way) are on the way to turn bullish, breaking through the middle level. Technically speaking, the US dollar index should continue strengthening versus major currencies, so it would be a bit early to go long on such majors as EUR/USD, GBP/USD, AUD/USD.

Gold analysis: technical take.


As far as the financial markets are seeking direction in the uncertain environment of coronavirus pandemic and US elections, the technical analysis becomes more essential for understanding the background of future trends. It’s been written and said many words about the price of gold as the safe-haven asset and the demand for the yellow metal from the side of speculators amid exceptionally high levels of liquidity in the financial system. The long-term fundamental outlook is definitely in favor of the price of gold. The only question I currently have is what is an attractive level to enter long positions on gold from a technical point of view. 

The most interesting timeframe to analyze, in my opinion, is the H4 chart as it combines the mid-term perspective with intraday price swings. The daily chart shows nothing to me, while the H1 chart is full of unnecessary noise. The chart setup below combines two different types of technical indicators with an in-depth graphical analysis and simple moving average. The SMA period I usually choose among Fibonacci numbers, and one of the most preferred is 89 as it reflects a much longer period and smoothes the noise related to short-term price fluctuations. ADX and DI, Chaikin oscillators have the default period, no need to change a thing there.

First of all, I pay much attention to the so-called median lines when I arrange an in-depth technical analysis. It’s not hard to build a support or resistance trendline, but they are not so informative as median lines as they do not show consolidation ranges. For example, you see that the uptrend is likely, but you struggle to identify the best entry point from which the price will soar. 

The most important median line on the chart above is the lower dashed green line. Four green arrows below it and one red arrow above it highlight reversal points of the intraday price action. Besides, the price of gold was in the consolidation range on October 23-28 before the bearish breakout. The recent bullish rebound was supported by the short-term support trendline, the angle of which does not look like it will hold for too long. On the other hand, the latest rally was limited by an important horizontal static resistance at $1909.13 per ounce, which coincides with the median. Therefore, if the bulls want to continue the upside pressure, which by the way is confirmed by long downside shadows on the latest candlesticks, then the price of gold has to clearly break the double resistance and chart several close quotes above $1910 per ounce. Once that happened (and I think that that’s just a matter of time), the next target will be shifted to a range between $1926.24 and $1930.48 per ounce. 

Indicators point to two concerns for the bulls. The ADX and DI indicator still have a bearish surplus as the red line is above the green line. Also, the mainline is below the threshold, which shows a weak momentum and thus the inability of bulls to keep the buying pressure. On top of that, the Chaikin oscillator has gone too far north from the middle line, promising a bearish retracement in the nearest future. Even if the price action will be range-bound, the oscillator must reload the overbought condition. Such a combination of two bearish factors allows me to wait for a deeper rebound south and therefore, a more attractive price for long positions. Shorting gold might be dangerous, given the overall bullish sentiment in the medium-term. This is why I prefer having a wait-and-see position, looking forward to attractive entry points for longs with the swing trading strategy.

Tuesday, October 9, 2018

How the bond yields and equities will affect the currency market in October

The first trading week in October was coinсident to the start of the fourth quarter in 2018. Key events that took place in this past trading week raised a lot of questions to traders and investors worldwide, and it was especially sensitive not only for the bonds and equities market players but also for currency speculators. Several unusual tendencies and divergences have been seen among different sectors in the financial markets, and these factors might have a huge impact on a potential shift in the focus for currency traders. I will try to explain a couple of the observations that I’ve had this week in order to be ready for such changes in the nearest future, and to make money on that, of course.

The fact number one. 10-year bond yields in the U.S. soared to 7-year high levels recently and reached the level of 3.21%. Well, it is not something extraordinary in the scope of the growing American economy, isn’t it? I mean, the economic expansion leads to the tightening cycle in the interest rates by the Federal Reserve, acting in to prevent overheating of the economy. But why do we see such an emotional and dramatic reaction by the market players, especially in the equities sector? Let’s try to figure out step-by-step. What is the mechanism for U.S. Treasuries? What drives the yield? The answer is always related to supply-demand stuff. The yield is determined by the nominal interest rates (set by the regulator), the inflation expectations and the market expectations of changes in these benchmarks.

So, for example, you are an investor who wants to buy a long-term U.S. government debt. Let’s say, you are interested in the 10-year period. You see that the current yield (your income at the end of the agreement) is 3.21% yearly. But at the same time, you predict that the real yield will grow as the Federal Reserve hikes the rates (3 hikes this year, one more hike is expected in December, and two more hikes are pencilled by FOMC for the next year). So, it is in your best interest to wait a couple of months and buy the same amount of government debt (10-year Treasuries), but with more benefit as the yield will grow. The same story happened to the vast majority of bond market players this week. Sellers were at the same level as before, but buyers stayed on hold after the Fed Chairman Powell noticed a possible acceleration in the interest rates hikes due to inflationary risks. Sellers were dominating at the bonds market and the price for Treasuries went down and the yield surged (the price is opposite to the yield).

The fact number two. That situation with the bond yields created a fear in the equities market. U.S. stock plunged 2-3%, finishing the trading week with the worst performance since May 2018, and coming off the recent all-time highs. The main concern was related to a single question: is the economy strong enough to withstand so many interest rate hikes? Traders understand that the increase in the borrowing costs creates an additional pressure on businesses, and that change might slow down the growth in corporate earnings, and the attractiveness of shares could be lower in this case. Add here the bullish speculative growth of the equities’ value, which started to show signs of a bubble, and you will get an average investor who is sitting on the multi-months profit, looking for the best time to take them in the pocket by closing long positions. What do you need to do if you want to close a long position? Right, sell. So, my point is that traders were looking for any reason to get out of the market, and, I think, the market reaction for Powell’s speech was overestimated, as it always happens.

But let’s get back to the currencies. The reason why I wrote so many words about the parallel universe is that markets do not exist in a vacuum. All of the financial sectors are related to each other and the impact of the bonds and equities markets is huge when it comes to the currencies. So, what was the greenback’s behaviour in this environment? It was going up, yes. At least, the U.S. dollar index grew 0.52% on weekly basis, but it went off the weekly high at 96.12, finishing the trading week at 95.60. But the correlation between the U.S. stock indices, the 10-year bond yields and DXY has certain changes. Moreover, the structure of the greenback’s growth compared to its peers was a bit different from the recent periods, and here are my suggestions why.


The daily chart above compares the U.S. dollar index (blue line), S&P 500 (red line) and U.S. Treasury-notes 10-year yields (yellow line). There is an obvious correlation between DXY and US10Y in the period of Spring 2018 when talks about rate hikes from the Fed were dominating in the market. We have a similar situation now when market players discuss faster-than-expected tightening by the Fed and US10Y had an immediate reaction. The stock indices sell-off is nothing but correction, in my opinion, and the things will get back to normal growth in a couple of weeks at least (or even much sooner than that). But why is the greenback pulling down? Why does DXY not react on the huge spike in the 10-year bond yields? I mean rising yields in the U.S. should attract overseas buyers and create an additional demand for dollar assets. The only explanation that I found is that the currency market delays with the same bullish reaction, and we might see much more active greenback bulls this week, when the CPI and PPI reports will be published, as there is an assumption that the inflationary pressure might be accelerated in September.
Another factor that is holding the greenback from a rapid expansion is that the vast majority of investors and currency traders are already long on the dollar index, and they need something much more powerful than Powell’s speech in order to increase the overall volume of long dollar positions. Add here a restructure of the DXY growth: it is going up versus commodity currencies (especially AUD and NZD, the weakest ones among majors), emerging market currencies (there is no demand for high-risk assets in the scope of the worldwide economic slowdown concerns and recent turmoil in Argentina, Turkey and Russia), Swiss franc (which is out of big six in the sense of trading volume after the plunge in 2015) and Euro (EUR/USD is going down, yes, but the bears’ achievements are very limited, to be honest). The British pound is showing first preliminary signs of reversal after multi-months bearish market, the Canadian dollar is hovering around 1.30 level without any significant movement from it.

The only currency which has to decline versus the greenback is supposed to be Japanese yen, and USD/JPY was showing perfect price action in the second half of September, but the bulls’ gains are limited amid recent sell-off in equities. Moreover, my suggestion is that USD/JPY together with EUR/USD, GBP/USD, and, accordingly, EUR/JPY and GBP/JPY should renew the bullish market in the tight correlation to the stock indices, once equities will find the bottom and reverse back North. Any disappointment in U.S. PPI and CPI data this week will ease woes about the 10-year bond yields, and stocks will pick up the bullish momentum again, increasing the worldwide risk appetite.

With that in mind, I am looking at USD/JPY in the scope of long positions in the medium term perspective. I suppose that the recent retracement is deep enough for the healthy correction from the technical point of view. The lowest price on Monday (112.79) exactly fits with 38.2% Fibonacci Retracement level of the bullish price action which started on August 21 (daily chart below). The latest top of the market is also placed around 113.00 level (113.17 to be precise). So it is normal for any asset to come back down to the breached level before making new achievements in the uptrend. The green dotted median magnetic line attracts the bulls, and they would not hesitate to use such a brilliant opportunity to test that line, in my opinion.


The intraday H4 chart below has several confirmations about that suggestion as well. Ichimoku Cloud Indicator with modified settings (13, 34, 55, 34) has completely bullish sentiment, and the support of the lower line of the span also held USD/JPY from the further slide. I expect USD/JPY to trade above 115.00 level (at least the first test with possible pullback) in 5-8 trading days from now (till October 19). Although, the main condition for that is the bullish reversal for equities in the United States (the rest of the world will follow one way or another). I already went long on USD/JPY (aggressively), and I’m ready to add more volume around 112.25/50 in a worth-case scenario.


Monday, September 3, 2018

This is why I keep selling cable.

There were some rumours about sterling to spike above 1.32 in 48 hours after Barnier had announced a Brexit deal last week. I thought: 'alright you can buy it, I will sell sterling with the pleasure 'cause I've got at least six reasons to do that'.

Just have a look at the H4 chart below and you'll get what I mean. I will consider taking profits around 1.2730/50 support.


Don't try. Do. Action is something that brings you to the next level. You should keep in mind that no thought, no word can enhance your ...